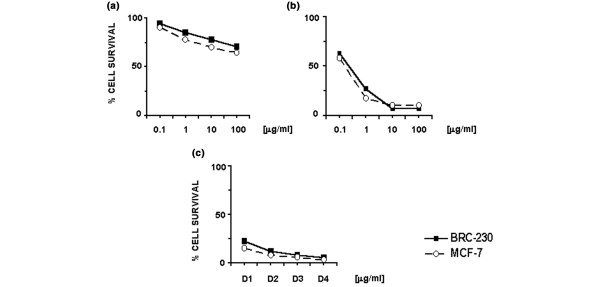
Figure 1.

Effect of different drug treatments on the survival of MCF-7 and BRC-230 breast cancer cell lines. (a) 5-FU, (b) Dox→Pacl sequence and (c) Dox→Pacl→5-FU treatment. D1, D2, D3 and D4 represent the doses of the three drugs used in the sequence (see Materials and methods). Each data point is the average of at least three independent experiments performed in octuplet. The standard deviation never exceeded 5%.
