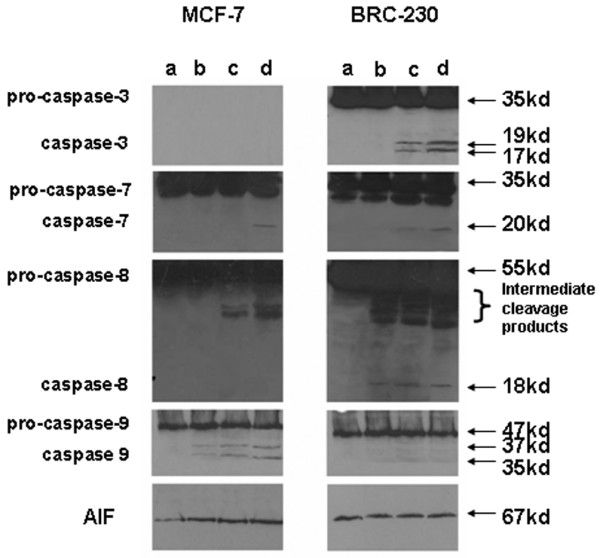
Figure 5.

Western blot analysis of caspases and apoptosis-inducing factor (AIF) proteins following different treatments. Protein (50 μg) was loaded for the controls and treated samples: (a) untreated cells; (b) Dox (0.1 μg/ml)→Pacl (0.1 μg/ml); (c) Dox (0.1 μg/ml)→Pacl (0.1 μg/ml)→48-h washout; (d) Dox (0.1 μg/ml)→Pacl (0.1 μg/ml)→48-h washout→5-FU (1 μg/ml).
