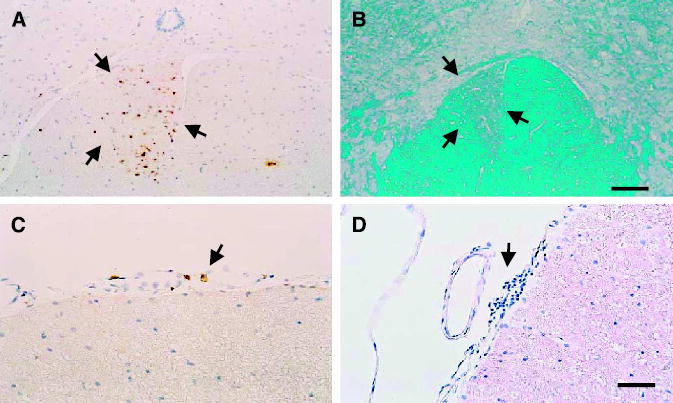
Figure 6.

Spinal cord neuropathology of animals surviving a large brain tumor for 6 months. Representative animals are illustrated herein. A and C, animals treated with RAdTK + RAdFlt3L and that survived tumor treatment for 6 months; A, distribution of macrophages (stained with ED1) in the corticospinal tract (outlined by black arrows), compatible with forebrain lesions to the pyramidal tract as caused by the growing tumor, and (C) indicates the distribution of T cells in the meninges of the same group of animals. Although the values of T cells in the meninges of these animals is extremely low, it is nevertheless higher than in animals not receiving any treatment. B, spinal cord of an animal treated with RAdTK and RAdCD40L stained with the Kluwer histochemical stain for myelin. Notice the unilateral area of demyelination in the spinal cord (outlined by black arrows), compatible with a lesion to the descending spinocortical tract, most possibly due to forebrain lesions to the pyramidal tract. D, largest infiltration of the meninges with T cells of any of the examined animals, and that was seen in an animal treated with RAdFlt3L and RAdIL12 (this animal displayed the largest tumor growth and brain inflammation at the time of sacrifice; data not shown). Bar, for all panels, shown in (D), 80 μm.
