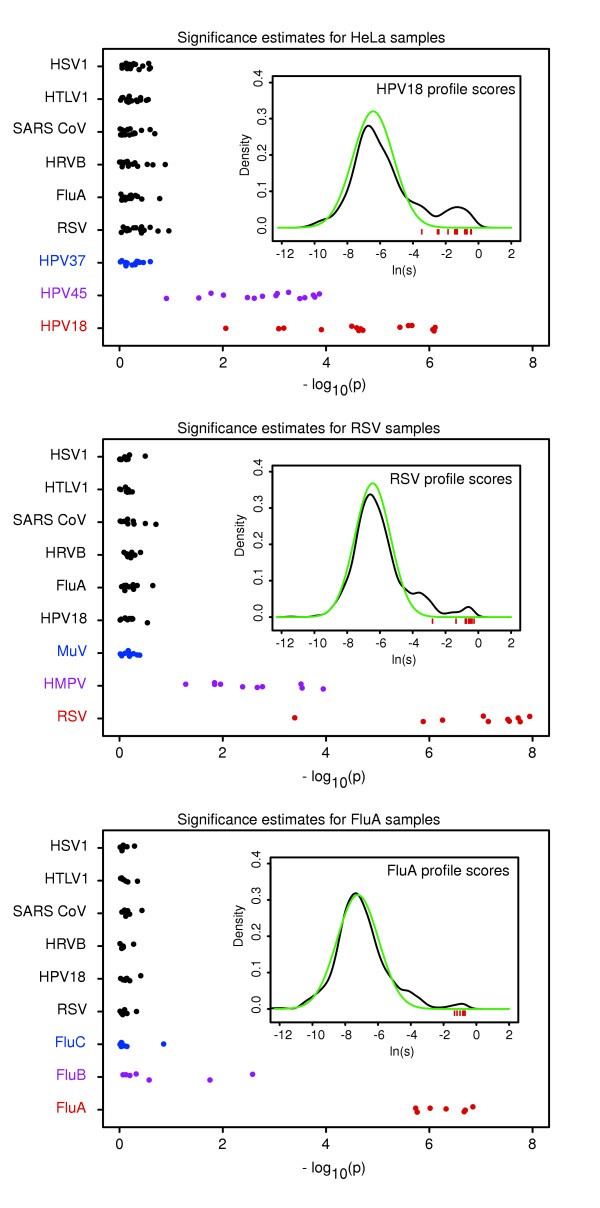
Figure 3.

Estimation of significance of individual similarity scores. Probabilities associated with the similarity scores of nine representative virus profiles obtained for the 15 HeLa, 10 respiratory syncytial virus (RSV), and seven influenza A virus (FluA) microarrays from the training dataset are shown in the top, center, and bottom panels, respectively. Each circle represents one microarray, and vertical 'jitter' is used to resolve individual circles. Probabilities for virus profiles from seven diverse virus families are included with each microarray set: herpes simplex virus (HSV)1; human T-lymphotropic virus (HTLV)1; severe acute respiratory syndrome coronavirus (SARS CoV); human rhinovirus B (HRV)B; FluA; human RSV; and three human papillomaviruses (HPV)18. Red circles represent match and black circles nonmatch interfamily profiles. Two intrafamily nonmatch profiles are also included and are different for the three microarray sets. The most closely related intrafamily profiles are represented by purple circles: HPV45, human metapneumovirus (HMPV), and influenza B virus (FluB). More distant intrafamily profiles are shown in blue: HPV37, mumps virus (MuV), and influenza C virus (FluC). The inset in each panel shows a normalized histogram (density) of the empirical distribution of log-transformed similarity scores for a match profile (black curve) and the corresponding normal fit representing true negative scores (green curve). Inset red bars depict observed log-transformed similarity scores corresponding to the match profile probabilities (red circles).
