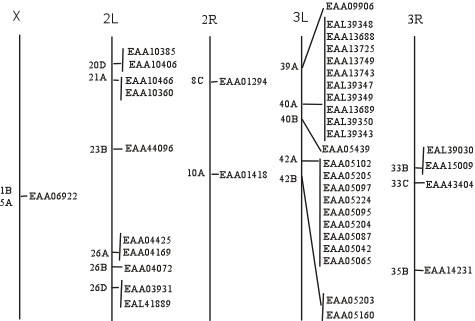
Figure 6.

Genomic distribution of FREP family members in A. gambiae. Chromosomes are represented with a line and chromosomal numbers are shown on the top of each chromosome. Chromosomal loci of the FREP genes are shown with their name. The proteins are denoted by their gene name in GenBank.
