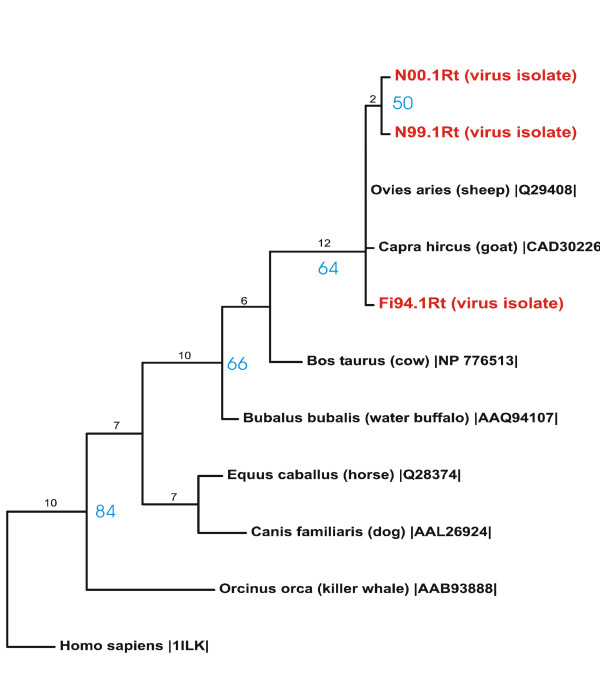
Figure 4.
Maximum Parsimony tree based on the translated nucleotide sequences of the Norwegian and Finnish reindeer vIL-10 gene amplicons obtained in this study, compared with corresponding amino acid sequences from mammals published in Genebank. Black numbers (branch length) describe the genetic distance/number of changes along the branch. Blue numbers (bootstrap values) describe the reliability for each clade in percent.

