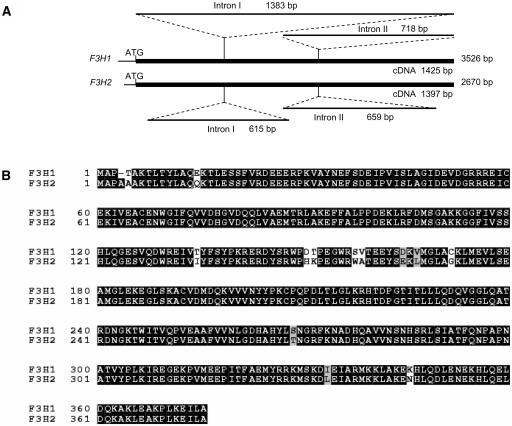
Figure 8.
Schematic Representation of the F3H1 and F3H2 Genes and Alignment of the Two Derived Amino Acid Sequences.
(A) The top schematic represents the genomic sequence of F3H1 obtained from PCR fragments amplified from the Wp line 1 (Table 1). The introns are indicated and their length given in base pairs. The bottom schematic represents the genomic sequence of F3H2 generated from PCR fragments amplified from the wp line 2 (Table 1). The location of the introns and their length are indicated. The full length of the cDNAs is given underneath the thick solid lines representing each gene, and the entire length of each genomic sequence is given to the right of each thick solid line.
(B) Alignment of the two derived amino acid sequences from F3H1 and F3H2. Black shading indicates identical amino acids. Gray shading indicates conserved residues, and unshaded amino acids represent differences between the two gene's amino acid sequences, including the Ser-to-Trp nonconserved amino acid change at position 158. Amino acid numbering is shown at left.

