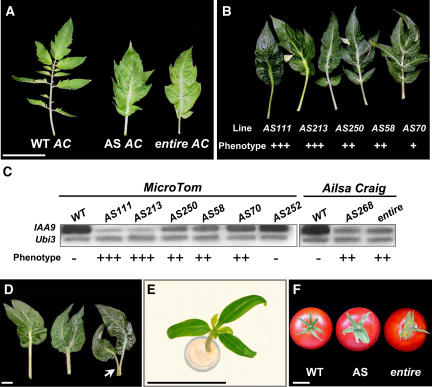
Figure 5.
Vegetative Growth Phenotypes of IAA9 Downregulated Plants.
(A) Tomato leaf morphology in wild-type Ailsa Craig (WT AC), IAA9 antisense (AS AC), and monogenic spontaneous mutant entire (entire AC) lines. Bar = 100 mm.
(B) Positive correlation between the severity of the simple-leaf phenotype and the level of downregulation of the IAA9 gene in MicroTom genotype. AS111 and AS213 are strongly inhibited lines, and AS250, AS58, and AS70 are weakly inhibited lines.
(C) RT-PCR analysis of IAA9 transcript accumulation in wild-type and antisense lines either in MicroTom (AS111, AS213, AS250, AS58, AS70, and AS252) or Ailsa Craig (AS268) genetic backgrounds and in entire mutant plants. Symbols indicate the presence (+) or absence (−) of leaf and parthenocarpy phenotypes. +++ designates lines with only simple leaves and a high percentage of parthenocarpy (60 to 100%); ++ designates lines showing both lobed and entire margin simple leaves and moderate percentage of parthenocarpy (30 to 40%); + designates lines displaying only lobed simple leaves and occasional parthenocarpy.
(D) Leaf fusion in IAA9 antisense lines consists of either fused twin leaves appearing as a single leaf with two terminal apexes (left), one petiole bearing two lamina (medium), or two leaves partially fused at the end of the petiole and forming a pin-like structure (right) as indicated by the arrowhead.
(E) Three-cotyledon structure often occurring in seedlings of strongly inhibited lines.
(F) Fused sepals in antisense lines. Wild-type fruit bear symmetrically arranged calyx, and AS-IAA9 (AS) and entire plants exhibit asymmetrical and partly fused calyx. Bars = 20 mm in (D) to (F).

