Figure 2.
Construction of Mutant Strains.
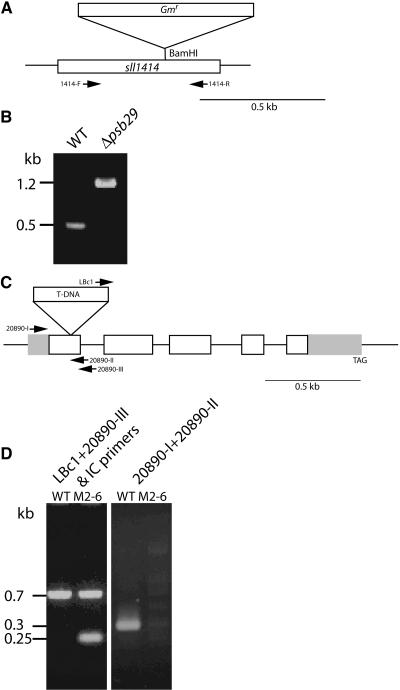
(A) Construction of the cyanobacterial Δpsb29 mutant. The diagram shows the site of the insertion and the positions of the PCR primers.
(B) PCR analysis of the segregation of the Δpsb29 mutant, using the same set of primers.
(C) Illustration of the genomic region of the At2g20890 gene. Gray boxes represent the 5′ and 3′ untranslated regions, and white boxes represent the coding sequence. The SALK_094925 line contains a T-DNA insert (not drawn to scale) in the first exon of the gene.
(D) PCR analysis of the segregation of the Arabidopsis M2-6 mutant. Primer sets used for the analysis are in slanted script above the gel.

