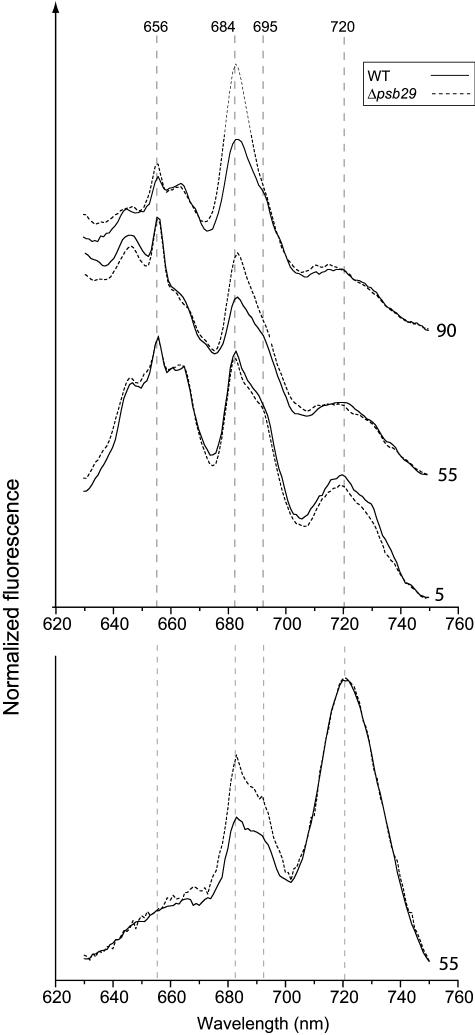
Figure 6.
77K Fluorescence Spectra of Synechocystis 6803 Wild-Type and Δpsb29 Cultures as Functions of Growth Light Intensity.
Excitation wavelength was set at 600 ± 1 nm (top) or 420 ± 10 (bottom). Vertical broken lines mark the emission maxima from phycobilisomes at 656 nm, the phycobilisome linker and PSII proximal antenna at 684 nm, PSII reaction center at 695 nm, and PSI reaction center at 720 nm. The curves are baseline shifted for clarity. The numbers on the right side of the curves indicate growth light intensity in μmol photons m−2 s−1. Curves were normalized to the fluorescence intensity at 750 nm.

