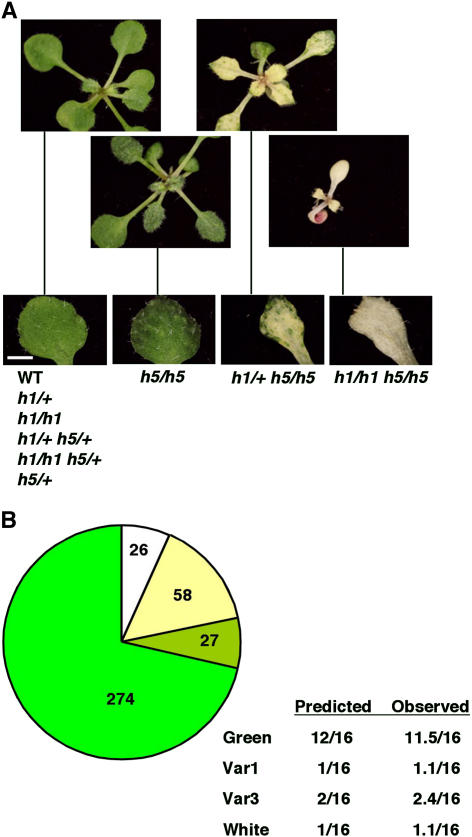
Figure 5.
A Cross between Homozygous Mutants in FTSH1 and FTSH5.
(A) Phenotypes of 3-week-old F2 seedlings and their corresponding single leaves are shown. The genotypes corresponding to these phenotypes, as revealed by PCR analyses similar to those shown in Figures 1 and 2, are indicated below the images. Bar = 1 mm.
(B) Segregation of phenotypes in the progeny of an h1/+ h5/+ double mutant. Seedlings looking like the wild type are represented by green, slightly variegated ones (Var1) are represented by light green, severely variegated ones (Var3) are represented by light yellow, and white ones are represented by white. The numbers of seedlings corresponding to each phenotype are indicated within the chart. Predicted and observed proportions are also indicated.

