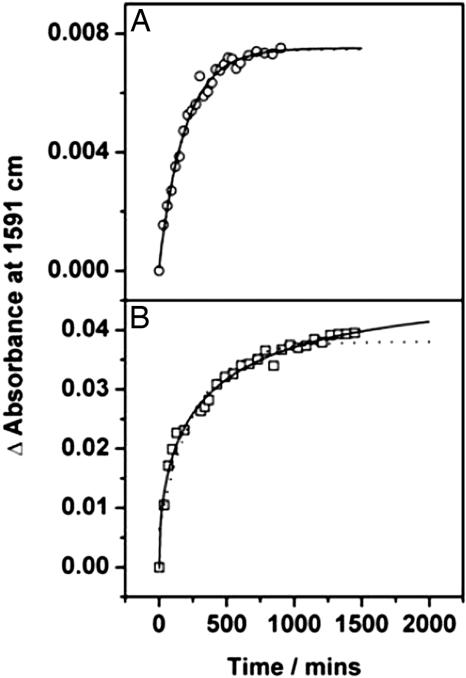
Fig. 4.
The kinetics of the alignment process at 35°C are shown at low (A) and intermediate (B) concentrations. Dotted lines through the data points show the monoexponential fits to the data; solid lines are the results of stretched exponential fits. At low concentration the data are well fit to a monoexponential curve; however, at higher concentration notable deviations from monoexponentiality are observed and the stretched exponential represents a much better fit to the data.

