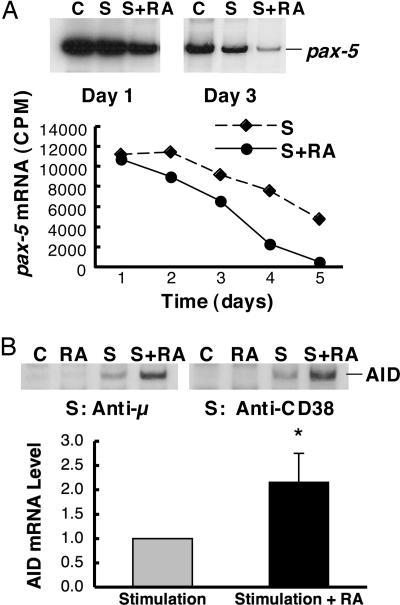
Fig. 8.
Regulation of pax-5 and AID gene expression during the activation of B cells in the presence of RA. B cells were cultured for different times, as shown, and then total RNA was subjected to RT-PCR analysis to assess pax-5 and AID mRNA levels. (A) Pax-5 expression in anti-μ and anti-CD38-stimulated B cells. (Inset) A gel showing the expression pattern of pax-5 on days 1 and 3 in the presence and absence of treatment. S represents stimulation with anti-μ and anti-CD38 (1 μg/ml for each). S+RA represents stimulation plus RA (10 nM). The chart illustrates pax-5 gene expression (cpm) in BCR and CD38 ligation-activated B cells during the 5-day experiment. (B) AID mRNA in B cells stimulated by anti-μ or anti-CD38, with and without RA, for 48 h. The chart summarizes n = 3 independent experiments. Stimulation represents anti-μ plus anti-CD38 (1 μg/ml for each). Data are presented as the ratio of AID mRNA in RA-treated cells compared with cells without RA. *, P < 0.05.

