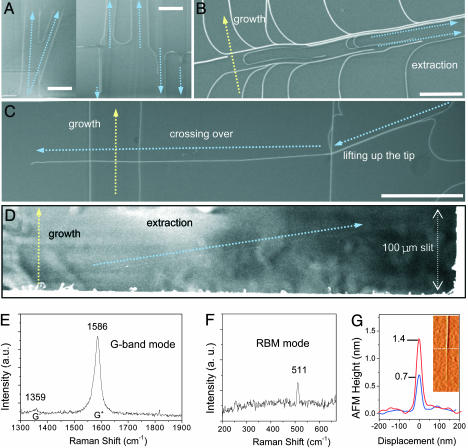
Fig. 2.
SEM images, Raman spectra, and AFM profiles illustrating the formation of complex patterns of nanotubes, as well as the extraction of the innermost SWNTs with subnanometer diameter. (A) SEM images of nanotube patterns formed by multiple extractions in different directions. (Scale bars: 2 μm.) (B) SEM images of nanotube patterns produced by AFM manipulation of the initial MWNT. (Scale bar: 10 μm.) (C) A SEM image of nanotube interconnections created by the “flying-tip” extraction scheme. (Scale bar: 50 μm.) (D) A SEM image of an extracted nanotube suspended across a 100-μm-wide slit in a silicon substrate. The extraction direction is perpendicular to the growth direction of the MWNT. (E and F) The G band and radial breathing mode peaks in the Raman spectra observed in D.(G) An AFM profile showing the thinnest diameter of extracted SWNTs of ≈0.4 nm. Inset is the corresponding AFM image, where the step in the height is marked with a dotted line.

