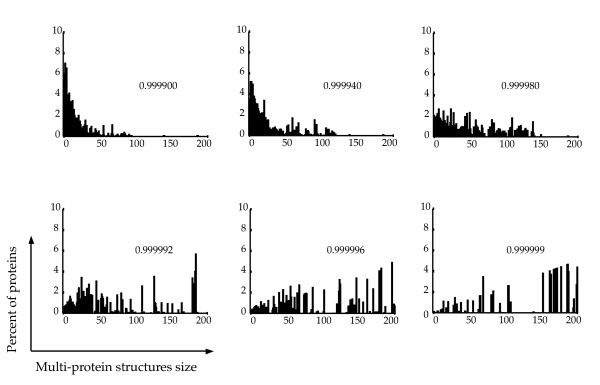
Figure 3.
Size of the structures generated using 3DSpi. The percentage of proteins belonging to the various size structures is shown, ranging from 1 to 216, as a function of a COS value ranging from 0.999900 to 0.999999. The program was run for 106 time points. The mean observed for the last 10000 time points on 40 different simulations is shown.

