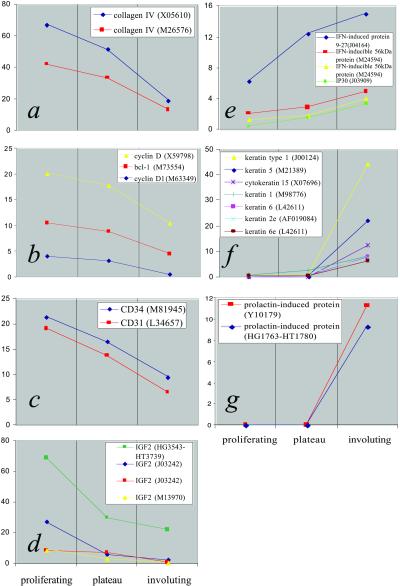
Figure 1.
Gene expression profiles of selected genes generated through DNA microarray analysis. Data represent average values obtained from three independent cases from each clinical phase. Genes are identified in the Insets, followed by their GenBank accession numbers (in parentheses). Some genes are represented by multiple probe sets on the arrays and are shown here. y axes represent normalized expression levels. (a–c) Expression of type IV collagen (a), cyclin genes (b), and CD31 and CD34 (c) decrease as hemangiomas progress toward involution, reflecting reduced endothelial proliferation in involuting tumors. (d) High IGF-2 message levels are found in proliferating hemangiomas, decreasing substantially in involuting tumors. (e–g) IFN-induced genes (e), keratins (f), and prolactin-induced protein (g) show increased expression during hemangioma involution.

