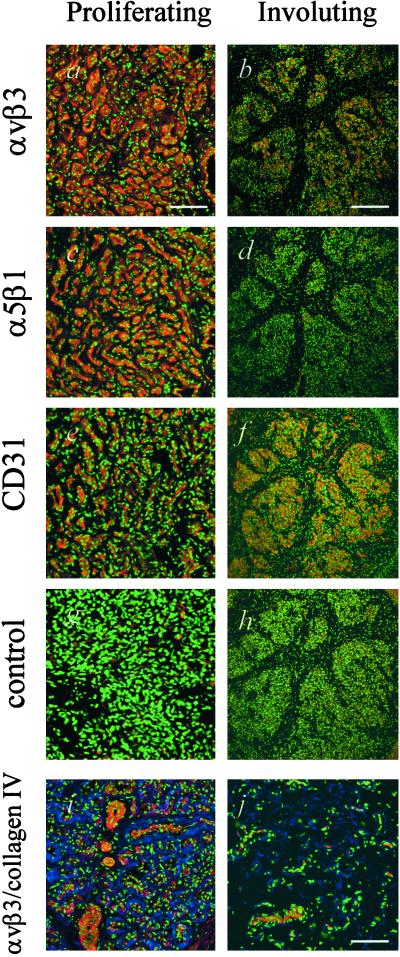
Figure 2.
Immunohistochemical analysis of hemangiomas. All sections were costained with DAPI to visualize nuclei (green). (a–h) αvβ3 integrin (red) is highly expressed in proliferating tumors (Bar = 100 μm) (a) and in the islands of hemangioma tissue remaining during involution (Bar = 300 μm) (b), α5β1 integrin (red) is expressed on the endothelium of proliferating hemangiomas (c) and to a lesser degree, in involuting tumors (d). Endothelium is identified by CD31 staining (red; e and f). Corresponding negative controls are shown (g and h). a, c, e, and g represent serial sections although a single specimen. b, d, f, and h similarly represent serial sections although a single specimen. (i and j) Collagen IV (blue) is highly expressed in proliferative lesions and is distributed around groups of αvβ3-positive (red) cells (i). Involuting tumors show fewer αvβ3-positive cells and less collagen IV (j). (Bar = 100 μm.)

