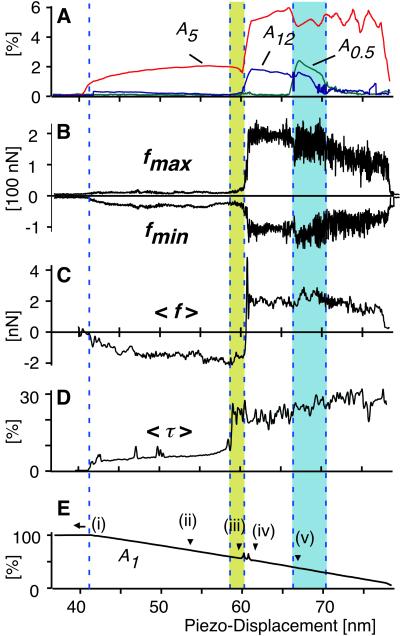
Figure 3.
Several parameters are shown, characterizing the tapping-mode approach curve on silicon under ambient conditions. (A) Signal amplitudes A5 and A12 (fifth and 12th harmonic to the fundamental frequency ω1 = 2π 46.2 kHz, respectively) indicate excitation of vertical eigenmodes 2 and 3, the appearance of contributions at 0.5 ω1 marks period doubling. (B) Maximal forces fmax reach +200 nN (repulsive force), whereas minimal forces fmin (attractive force) become more pronounced with the onset of mechanical contact (−40 nN to −100 nN). (C) Along with this transition, the force averaged over one cycle 〈f〉 changes sign, but remains within ±2 nN. (D) The average duration of the interaction 〈τ〉 increases from 7% for purely attractive interaction to more than 25% for repulsive dominated interaction. (E) For orientation, the amplitude A1 at the excitation frequency ω1 is given. It decreases linearly with decreasing mean tip-sample distance. The distinct regimes and transitions are marked i–v. The arrows point to the positions where the events of Fig. 5A were taken.

