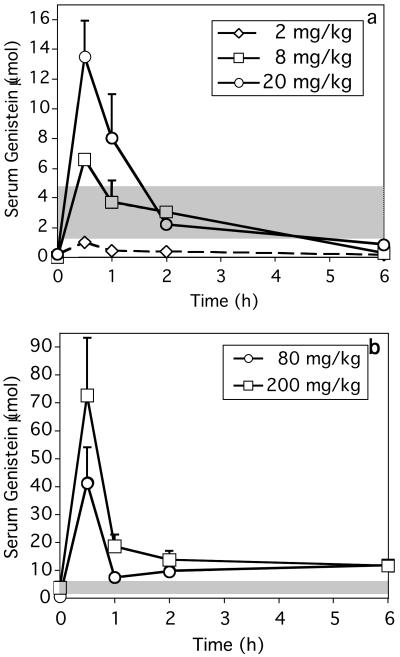
Figure 4.
Serum genistein levels in mice after injection of (a) 2–20 mg/kg or (b) 80–200 mg/kg of genistein. Data are mean ± SE and n = 5 for all points. Shaded bands represent the range of plasma genistein levels in 4-month-old soy-fed human infants (3). (a) Serum genistein after the 2 mg/kg dose was less than in soy-fed human infants. The 8 mg/kg dose produced genistein levels comparable to those in soy-fed human infants for the first 2 h postinjection; genistein declined to minimal levels by 6 h and was undetectable 24 h postinjection. The 20 mg/kg dose produced peak levels 3-fold greater than those in soy-fed human infants, then levels declined, equaling those in the 8 mg/kg dose by 2 h postinjection and becoming minimal by 6 h. (b) Genistein levels after injection of 80 or 200 mg/kg showed a temporal pattern similar to lower doses, although absolute levels from 0.5 to 6 h exceeded those in soy-fed human infants. Note different scales in a and b.

