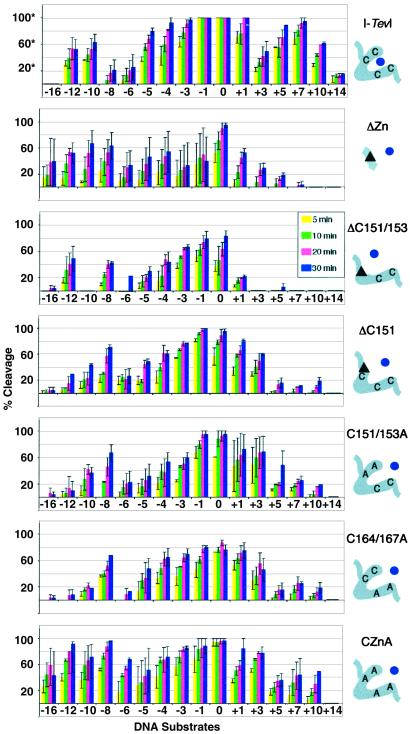
Figure 4.
Summary of cleavage data of zinc-finger mutants. Each graph represents the compiled data for one protein on the different DNA homing sites. The homing sites are ordered from deletions to wild type to insertions from left to right [−16, −12, −10, −8, −6, −5, −4, −3, −1, 0 (wild type), +1, +3, +5, +7, +10, and +14]. The average percent cleavage at four time points is presented for each protein/DNA pair (5, 10, 20, and 30 min). *, The % cleavage for wild-type I-TevI was derived at a 3-fold lower protein concentration than was used for the mutants. The data for which 100% cleavage is seen with no error bars indicate that the DNA was completely cleaved under the conditions of this experiment; cleavage activity is in reality higher. Accurate relative activities of the mutants compared with wild-type I-TevI on wild-type homing-site DNA are given in the text. The mutant proteins were all run at equivalent concentrations and can be compared with one another directly. Error bars represent the SD in the data from 2–5 cleavage assays. The schematic on the right corresponds to the boxed portion of I-TevI in Fig. 3A. The zinc ion (dot) is shown either coordinated (wild-type I-TevI) or not (mutants). The triangles correspond to deletions.

