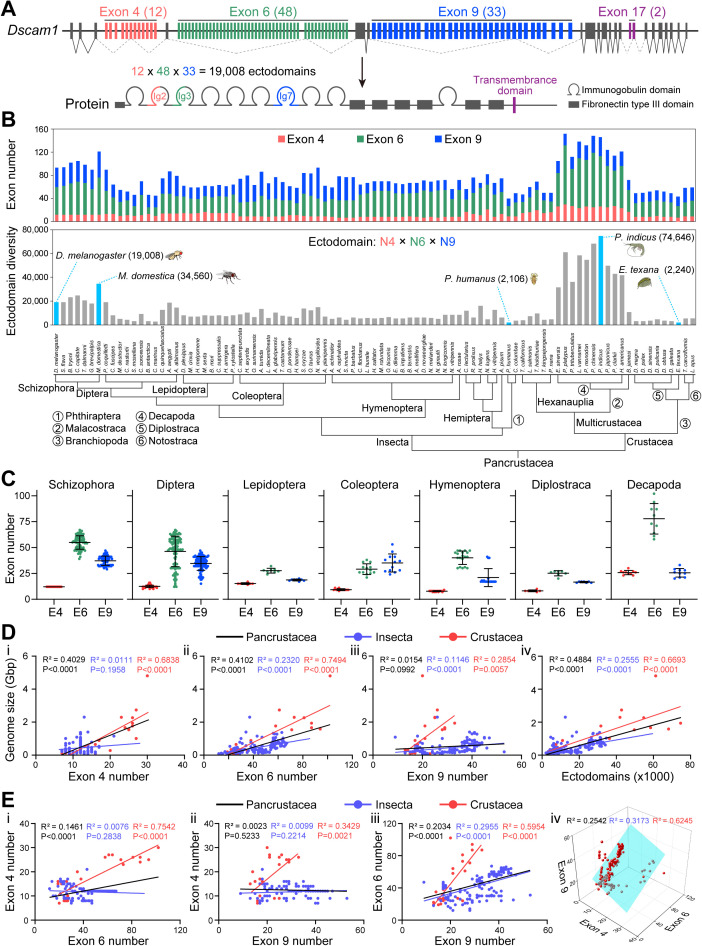
Fig 1. Dscam1 gene structure and isoform diversity in pancrustacean species, also see S1 Fig.
(A) Schematic diagrams of Drosophila melanogaster Dscam1 gene and protein structure. The variable exons or domains are shown in color, while the constant exons or domains are shown in gray. (B) Phylogenetic distribution of Dscam1 isoform diversity. A phylogenetic tree of Pancrustacean species is shown in the lower panel. Upper panel: distribution of the number of exons in variable exon 4, exon 6, or exon 9 clusters in Pancrustacean species, with variable exon clusters shown in different colors. Middle panel: distribution of the number of potential ectodomains diversity, where species with a special number of diversities are highlighted. (C) The distribution of the number of variable exons 4, 6, and 9 in different evolutionary representative clades is shown, respectively. (D) Correlation analysis between the number of variable exons or the ectodomain diversity and the genome size in 178 species. (E) Pairwise correlation analysis of exon numbers between variable exon clusters, and three-dimensional correlation analysis of the number of exons 4, 6, and 9. The data underlying this figure can be found in S1 Data.

