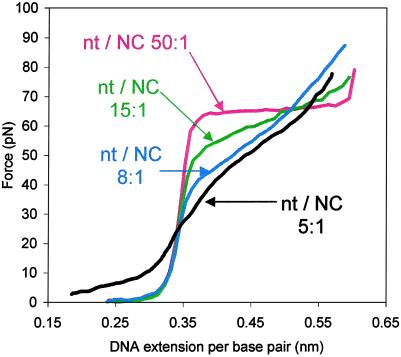
Figure 2.
DNA stretching curves in 10 mM Hepes, pH 7.5, containing 10 nM NC and 150 mM (red line), 75 mM (green line), 50 mM (blue line), and 25 mM [Na+] (black line). These concentrations correspond to an estimated 50:1, 15:1, 8:1, and 5:1 nucleotide/NC ratio, respectively (11), as indicated on the graph.

