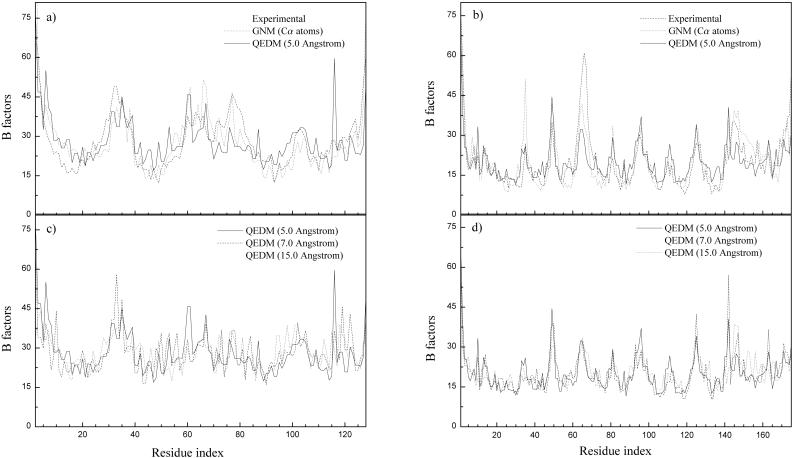
Figure 2.
Comparison of computed and experimental B-factor curves for 2CCY (a and c) for 1AQB (b and d). In a and b, GNM uses the Cα positions, and QEDM uses a 5-Å electron-density map. In c and d, QEDM is applied to electron-density maps of 5 Å, 7 Å, and 15 Å resolution. B-factors on the centroids of Voronoi cells computed at low resolutions by QEDM were mapped onto the Cα atoms based on a distance averaging method—i.e., the average B-factors on the centroids within 1.9 Å (half of the nearest Cα–Cα distance along the polypeptide chain) from a particular Cα atom is assigned to that Cα atom. Every B-factor curve is normalized against the experimental curve by matching the areas underneath the two curves. The cutoff distance was 6.8 Å.

