Figure 3.
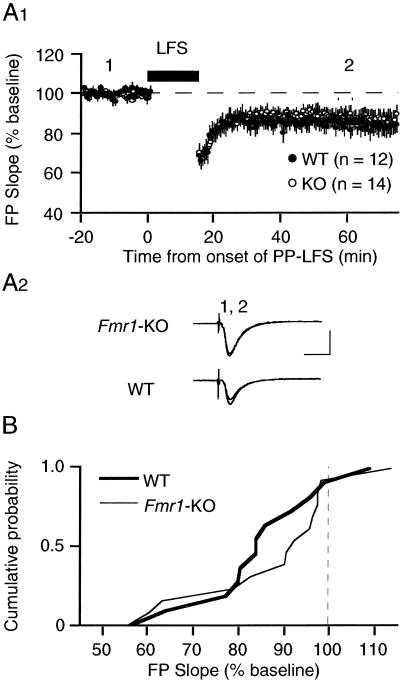
Synaptic induction of NMDAR-dependent LTD using a 1-Hz LFS protocol is comparable in Fmr1-KO mice and WT controls. (A1) Average time course of the change in FPs after LFS. LTD in KO animals measured 86 ± 4% of preLFS baseline (n = 14 slices from 8 mice; open circles) as compared with 84 ± 4% in WT controls (n = 12 slices from 4 mice; filled circles; P = 0.6, t test). (A2) Representative FPs (2 min average) taken at the times indicated by the numbers on the graph. (Bar = 1 mV, 10 msec.) (B) Cumulative probability distributions of FP slope values (% of baseline), measured 1 h after LFS in individual slices from both KO and WT groups. The distribution in KO mice is not significantly different from that in WT mice as determined by the Kolmolgarov–Smirnov test. All experiments were performed blind.

