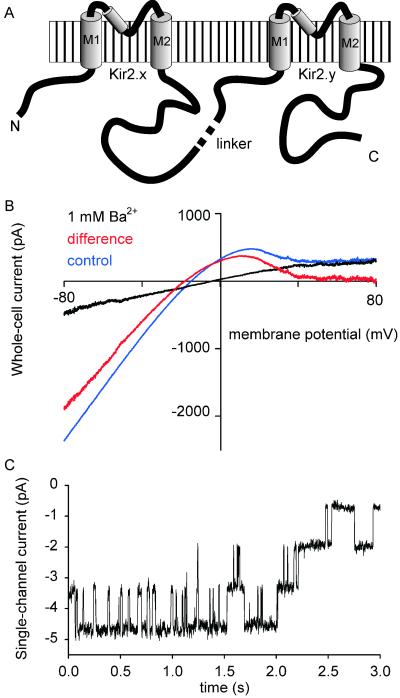
Figure 1.
Expression of Kir2.2–Kir2.1 concatemers in HEK293 cells. (A) Schematic diagram of Kir2.x–Kir2.y concatemers. (B) Current–voltage relation of Kir2.2–Kir2.1 expressed in HEK293 cells; blue, control; black, with 1 mM Ba2+; red, difference curve. (C) Cell-attached recording (at −60 mV) of single inwardly rectifying channels, carried out 24 h after transfection of HEK293 cells with Kir2.2–Kir2.1 concatemers.

