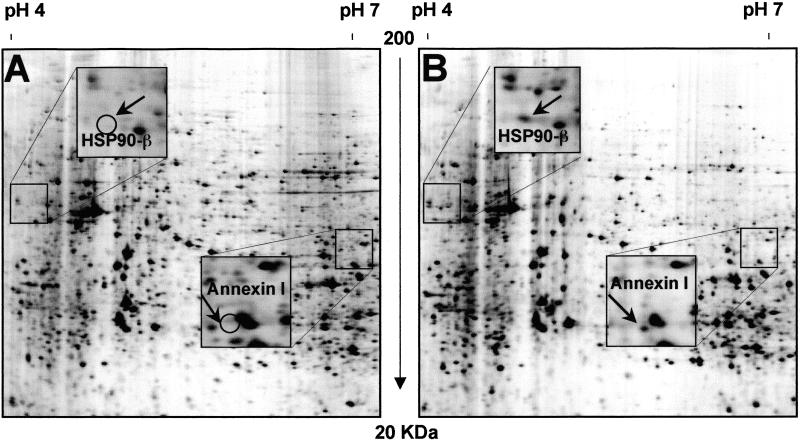
Figure 2.
Silver-stained details of two-dimensional gel electrophoresis polypeptide maps of uninduced 106 cells (A) and DMSO-induced LA7 cells (B). Spots were named after protein identification by mass spectrometry analysis. Squares in the pictures indicate regions magnified containing HSP90-β and annexin 1 spots. Differential expression of HSP90-β and annexin I proteins is indicated with open circles (A).

