



Abstract
Nearly one-third of the global population is affected by cardio-kidney and metabolic (CKM) diseases; however, the molecular mechanisms underlying CKM diseases are poorly understood. We show that tissue proteomics provide critical insights not captured by tissue gene expression or blood proteomics information by performing whole genome and RNA sequencing and proteomics analysis of human kidney samples (n=337), and generated a publicly available database. Via Bayesian colocalization and Mendelian randomization analyses of kidney protein quantitative trait loci and 36 CKM genome-wide association studies, we prioritized 89 proteins for CKM traits. We prioritized relationships that could underlie the interconnectedness of CKM traits and discover multiple and targetable mechanisms for CKM diseases, including the potential role of kidney angiopoietin-like 3 in serum lipid levels and kidney function as well as the role of charged multivesicular body protein 1A in kidney function and hypertension. Importantly, we identify pathways with confluence of evidence from genetic loci, tissue gene expression, and protein levels for CKM traits. In summary, our large-scale kidney proteomics study uncovers proteins and targetable mechanisms prioritized for CKM diseases.
Introduction
Cardio-kidney and metabolic (CKM) diseases represent an interconnected syndrome involving cardiovascular, renal, and metabolic dysfunctions, significantly impacting global health1. Recently the term CKM syndrome has been coined to highlight the interconnected relationships between heart disease, chronic kidney disease (CKD), and metabolic disorders such as diabetes and obesity, creating a vicious cycle of organ damage. The interconnected nature of CKM traits necessitates a holistic approach to diagnosis and treatment, focusing on common underlying molecular mechanisms rather than single components. This potential common disease mechanism is highlighted by the response to drugs such as sodium–glucose co-transporter 2 inhibitors (SGLT2i) or glucagon-like peptide 1 receptor agonists (GLP1RA). Identifying common disease-driving mechanisms is critical, as the pathomechanism of CKM remains poorly understood.
Common single nucleotide variants (SNVs) associated with kidney function and disease can be mapped by genome-wide association studies (GWAS). However, almost all GWAS significant variants are localized to the non-coding regions of the genome2, and identifying the target genes and cell types is an arduous task. The analysis of quantitative trait loci (QTL) such as expression QTL (eQTL), methylation QTL (meQTL), and protein QTL (pQTL) could provide critical insight for causal gene and pathway identification. Recently, multiple groups have generated kidney-specific expression QTL information3–8. While RNA levels provide important insight, proteins are the primary effectors of cellular function, and RNA is often used as a proxy to estimate protein abundance. The importance of proteomics has nicely been demonstrated by the recently released plasma protein QTL datasets from the UK Biobank9–11, providing critical and novel disease insights. Although a recent mass spectrometry-based proteome-wide association study12 characterized kidney protein levels using 72 samples of normal adjacent tissue from the Clinical Proteomic Tumor Analysis Consortium (CPTAC), along with matched whole genome sequencing (WGS), comprehensive tissue-level protein datasets remain limited. Most previous studies including those linking plasma pQTLs with cardiometabolic GWAS traits through polygenic risk scores, have analyzed plasma samples and not kidney tissue13.
We hypothesized that human kidney proteogenetic information will provide much needed molecular insights into CKM pathogenesis. We generated the unbiased human kidney proteomics dataset by quantifying over 7,000 proteins in over 300 samples, complemented by genetic and gene expression analysis. Here, we report human kidney pQTLs and nominate potentially disease-causing proteins for CKM using Bayesian colocalization and Mendelian randomization. Tissue proteomics identify genes and targetable pathways not observed in prior plasma proteomics and tissue gene expression studies.
Result
Human Kidney Tissue pQTL Analysis
Our primary dataset contained 337 human kidney cortical tissue samples, on which we performed SomaScan-based proteomics, bulk RNA sequencing (RNA-seq), and WGS (Fig. 1a). The mean estimated glomerular filtration rate (eGFR), calculated using the latest CKD-Epi formula14, was 64±23 ml/min/1.73m2 at the time of collection. The mean age was 62.0±13.2 years, and 34.8% were women. The predominant genetic ancestry, determined using WGS data, was European. The full clinical and demographic information is presented in Supplementary Table 1. Proteomics, RNA-seq, and WGS data underwent standard quality control (QC) procedures (Methods, Supplementary Table 2). We utilized 325 samples for proteomic analysis, 315 for RNA-seq, and 328 for WGS (Methods and Fig. 1a).
Fig. 1. Integrative Multi-Omics Analysis of Human Kidneys.

(a) Human kidney multi-omics analysis comprising proteomics with SomaScan, bulk RNA sequencing, and whole genome sequencing (WGS) across 6,903 proteins, 21,358 genes, and 13,333,246 autosomal variants. Our comprehensive approach involved kidney pQTL and eQTL analyses, utilizing colocalization and Mendelian randomization (MR) with eGFR and SBP/DBP GWAS data to evaluate protein and gene causality in the primary analysis. We also included kidney eQTL and plasma pQTL data and 36 CKM GWAS to prioritize candidate proteins and genes for CKM.
(b) Miami plot illustrating human kidney pQTL and eQTLs, showing chromosomal location (x-axis) and associations strength (log10(FDR), y-axis).
(c) Boxplots of normalized protein levels for significant pQTL ACP1, NTAQ1, and SIRPA, stratified by the genotype of their respective lead SNVs (n=321).
(d) Venn diagram depicting the unique and overlapping pQTL proteins identified in both UK Biobank plasma and kidney tissue pQTL studies utilizing the SomaScan platform (parentheses indicate unique SomaScan counts).
(e) Scatter plots of effect size correlation between UK Biobank plasma pQTL and our kidney tissue pQTL datasets.
(f) Boxplots of normalized gene levels for significant eQTL genes ERAP2, FAM21A, and SNHG5, stratified by the genotype of their respective lead SNVs (n=311).
(g) Venn diagram of shared and unique eQTL genes and pQTL proteins in kidney tissue.
(h) Correlation of effect sizes between kidney pQTLs and eQTLs, with a focus on the extent to which genetic variants influence both protein levels and gene expression.
QC, quality control; pQTL, protein quantitative trait loci; eQTL, expression quantitative trait loci; GWAS, genome-wide association studies; CKM, cardiovascular-kidney-metabolic; SBP, systolic blood pressure; DBP, diastolic blood pressure; SMR, summary data-based Mendelian randomization; GSMR, generalized summary-data-based Mendelian randomization; HEIDI, heterogeneity in dependent instruments; FDR, false discovery rate.
Each dot in (c) and (f) represents an individual patient. Box plots show the median, 25th and 75th percentiles, and values within 1.5× the interquartile range. Group differences were assessed using one-way ANOVA. Correlations in (e) and (h) used Spearman’s rho with two-sided P values. Blue dots indicate shared significant variant–protein pairs; grey dots indicate others.
To understand the effect of genetic variations on kidney protein levels, we performed genome-wide testing of 13,333,246 autosomal variants for 6,903 protein levels using a linear regression model that included clinical variables and probabilistic estimation of expression residuals (PEER) factors (Supplementary Fig. 1a, b). We considered a ±1-Mb window around the transcription start site (TSS) for variant positions. This initial cis-pQTL analysis identified 873 proteoforms associated with at least one SNV with a false discovery rate (FDR) of q<0.05 (Fig. 1b, c and Supplementary Table 3). Among these, 804 unique proteins were classified as intracellular (512; 64%), membrane-associated (162; 20%), and secreted (130; 16%) (Supplementary Table 3). The majority of pQTLs were close to the TSS of the cognate gene (Extended Data Fig. 1a), and their effect sizes showed strong dependence on the distance from the TSS (Extended Data Fig. 1b) and inversely related to their minor allele frequency (MAF)15 (Extended Data Fig. 1c). The average heritability estimate across all cis-pQTL proteins was 0.08, which was consistent with the cis-specific contributions reported in the UK Biobank plasma pQTL study9, where the mean total SNV-based heritability, including both cis and trans contributions, was 0.16. Coding variants had larger effect sizes compared to other pQTL alleles (Extended Data Fig. 1d–f) when the functional consequences of lead SNVs for 873 pQTLs were investigated using the Ensembl Variant Effect Predictor (VEP)16.
To assess the robustness of our pQTL findings, we investigated the impact of additional covariates (sample age17, diabetes mellitus, hypertension) and identified 862 significant pQTLs, with 96% overlapping the primary results (Supplementary Table 4 and Supplementary Fig. 2a, b). The high concordance supports the robustness of the primary analysis, which we used for further investigations. Next, to assess the influence of ancestry, we performed a European-only analysis (n=279), identifying 828 pQTLs with a high correlation in effect sizes and p-values compared to the primary results (Supplementary Table 5 and Extended Data Fig. 2a–c). Using the European population pQTL dataset (828 pQTLs, 760 unique proteins), we performed conditional analysis and identified 615 loci, of which most (84%, n=515) were associated with a single protein, consistent with previous findings9,11. Pleiotropy (≥2 proteins) was observed at the remaining loci (Supplementary Table 6 and Extended Data Fig. 2d). The strong concordance between multi-ancestry and European-only analyses supports the use of multi-ancestry pQTL findings in downstream analyses to maximize statistical power.
Recognizing the role of sex differences in kidney disease progression18, we conducted sex-stratified pQTL analyses, including chromosome X. While no significant associations were found on chromosome X, autosomal analysis identified 559 pQTLs in males (n=211) and 202 in females (n=110). Of these, 24 were male-specific and 8 were female-specific compared to the primary analysis (Supplementary Table 7, 8 and Supplementary Fig. 3).
As rare variants are known to have larger effect sizes on gene expression and protein levels19, we extended our analysis to assess their impact on kidney protein expression. We performed a rare variant analysis (0.1%<MAF<1%) using a burden test to enhance statistical power. This analysis identified only one significant protein association (COL11A2, FDR = 0.02), likely reflecting limited power due to the small sample size.
Building on the cis-pQTL findings, we explored the potential trans effects by conducting a trans-pQTL analysis. In this analysis, we identified 455 significant variant-protein pairs (P<7.24×10^−12, i.e. 5×10^−8/6903), corresponding to 451 unique proteins (Supplementary Table 9). While this dataset will require additional validation, these results suggest additional genetic regulation beyond the cis level. To further investigate potential biological interactions, we focused on ligand-receptor interactions among the identified pQTL proteins. Using the CellTalkDB database20, we identified 71 ligands and 52 receptors from the 873 significant pQTLs (representing 804 unique proteins), resulting in 19 ligand-receptor pairs. These pairs were further evaluated for significant trans-pQTL signals (Supplementary Table 10), with the platelet-derived growth factor D (PDGFD) and platelet-derived growth factor receptor beta (PDGFRB) interaction shown as an example (Methods, Supplementary Fig. 4).
Integration with eQTL and External Datasets
In the absence of a previous kidney pQTL dataset, we sought to compare our results with recently published large-scale plasma pQTL studies (also performed on the SomaScan platform)9–11. From the 873 identified significant kidney cis-pQTL signals, 383 (44%) were not previously identified signals (Supplementary Table 3). The effect size correlation between the UK Biobank blood pQTL9,21 and our kidney pQTL was around 0.5 (Fig. 1d, e), indicating that while blood plasma studies provide some insights, tissue analysis remains critically important for disease understanding.
Since the SomaScan platform was not specifically developed to assess kidney proteins, we further evaluated the expression of these 873 kidney pQTL proteins, of which 98% (860/873) and 97% (843/873) were detected in the Protein Atlas and GTEx RNA database, while 78% (684/873) and 67% (588/873) were detected in the Protein Data Commons and Protein Atlas at the protein level (Supplementary Table 3).
To further contextualize assay sensitivity and coverage, we compared the full set of quantified proteins and transcripts in our dataset with established resources. At the protein level, 3,954 of 10,250 proteins (39%) from the Human Protein Atlas and 3,799 of 8,317 kidney-specific proteins (46%) from the Protein Data Commons were detected by SomaScan. Among 17,212 kidney-expressed genes reported by the Human Protein Atlas and 16,145 from GTEx, 16,155 (94%) and 15,695 (97%) were detected in our dataset, respectively (Supplementary Fig. 5a–d; Supplementary Tables 11 and 12).
We then conducted cis-eQTL analysis on 315 human kidney samples. Using the described pipeline, we identified 2,222 significant eQTLs (q<0.05, referred to as eQTL genes) (Methods, Fig. 1b, f, and Supplementary Table 13), with 91% (2,024 out of 2,222) being previously reported3,7,8 (Supplementary Table 14). Most eQTLs were near the TSS of their corresponding gene (Supplementary Fig. 6a), and eQTL effect sizes showed an inverse relationship with MAF (Supplementary Fig. 6b).
Previous reports have shown only a modest correlation between RNA and protein expression levels22,23. To better understand this relationship, we compared pQTLs and eQTLs from the same tissue samples. We identified 10% of the significant eQTLs replicating in pQTLs and 28% of pQTLs replicating in eQTLs (Fig. 1g). This modest overlap is consistent with findings in other tissues, such as 17% in heart tissue24 and 11% in liver tissue25. The pQTLs and eQTLs effect size correlation indicated an overall correlation of 0.49 for all matched SNV-protein SNV-gene pairs (Fig. 1h), emphasizing that kidney eQTLs inadequately reflect kidney pQTL information. Despite the limited pQTL sample size and the limited number of analyzed proteins, we found that 177 (20%) pQTLs had not been previously reported by prior large-scale eQTL analysis (Supplementary Table 3). To further validate our findings, we evaluated the top 10 kidney pQTL signals available on the Olink Explore HT platform (Supplementary Fig. 7) and quantitative multiplexed mass spectrometry26 (Supplementary Fig. 8). In concordance with other large scale plasma proteomics datasets, our validation showed a similarly moderate level of agreement in expression patterns across methods21,26.
In summary, we generated proteomic, transcriptomic, and genetic information for over 300 human kidney samples and created the human kidney pQTL atlas. Our findings demonstrate that tissue protein analysis provides important orthogonal insights that are not captured by blood protein and tissue gene expression analysis.
Genetic Impact of Drug Metabolism and Complement in Kidney
To understand the broader biological pathways influenced by human genetic variations in the kidney, we conducted pathway analysis of our renal tissue-derived pQTL results. These analyses demonstrated significant enrichment for metabolism, including glutathione (FDR=4.0×10^−7), drug (FDR=1.6×10^−4), xenobiotic (FDR=1.3×10^−4), and nucleotide (FDR=5.8×10^−6) metabolism pathways (Supplementary Tables 14 and Extended Data Fig. 3a). Our results are consistent with the kidney’s role in metabolism and detoxification.
Pathway analysis also revealed significant enrichment for the complement pathway (FDR=2.8×10^−5) among the top results, with pQTLs identified across all three arms of the complement pathways: classical, lectin, and alternative (Supplementary Tables 14 and Extended Data Fig. 3b). Gene set enrichment analysis using the Molecular Signatures Database (MsigDB) further supported these results, highlighting the enrichment of xenobiotic metabolism (FDR=7.4×10^−7) and complement (FDR=7.3×10^−3) pathways (Supplementary Table 15). Along with these pathways, fatty acid metabolism (Supplementary Fig. 9) was significantly enriched in KEGG (FDR=6.9×10^−3) and MsigDB (FDR=7.3×10^−3). Such pathway enrichment analysis should be interpreted with caution as the SomaScan platform is not yet full genome scale. While these results do not directly identify risk proteins, they provide an important overview of proteins influenced by genetic variations in the kidney.
Prioritizing Proteins for Kidney Function via Colocalization
Genome wide association studies (GWAS) identify common genetic variants with causal association for disease development27. However as most common variants are non-coding, our next goal was to identify effector genes and proteins explaining the genotype effect on kidney disease development. We utilized Bayesian colocalization (coloc)28 to probe the posterior probability for a shared causal variant between pQTL/eQTL and significant genetic variants from our recently established eGFR GWAS involving 2.2 million individuals29, with a posterior probability threshold of PP.H4≥0.8 (Fig. 2a). Our analysis identified 70 coloc proteins and 131 coloc genes (107 protein-coding genes and 23 non-coding genes), of which 47(67%) coloc proteins and 79 (60%) coloc genes were not previously published3,7 (Table 1, Fig. 2b, and Supplementary Table 16–18).
Fig. 2. Integrated Analysis of Kidney pQTL/eQTL and eGFR GWAS to Prioritize Kidney Disease Candidate Proteins/Genes.

(a) Integration of eGFR GWAS and kidney pQTL and/or eQTL data using Bayesian colocalization analyses: coloc and moloc.
(b) Venn diagram representing the proteins identified as kidney pQTLs and genes identified as kidney eQTLs, with colocalization to eGFR GWAS. A total of 804 unique pQTL proteins (from 873 significant signals) and 2,222 eQTL genes were analyzed.
(c) LocusZoom plots displaying the association signals for eGFR GWAS, kidney PLA2R1 pQTL, PLA2R1 eQTLs, and plasma PLA2R1 pQTL. LD is from 1,000 Genomes European data. Plasma pQTL data are from the FENLAND cohort.
(d, e) Box plots illustrating the association of lead SNV of PLA2R1 (rs3749117) alleles with kidney PLA2R1 (d) protein measured by SomaScan (n=321) and (e) RNA expression levels (n=311).
(f) Box plots illustrating the association of lead SNV of PLA2R1 (rs3749117) alleles with kidney PLA2R1 protein (n=315), measured by quantitative multiplexed mass spectrometry.
(g) Scatter plot of effect sizes eGFR GWAS (y-axis) and kidney PLA2R1 pQTL (x-axis), with effect sizes calculated relative to the reference allele. Orange dots represent rs3749117. Spearman’s rho with two-sided p value was used for correlation.
(h) Mendelian Randomization (MR) effect sizes, relative to the reference allele rs3749117-T, and their significance (P-values) for PLA2R1 across various cardio-kidney-metabolic GWAS traits. The x-axis shows the MR effect size; the y-axis, traits. The dot size corresponds to the −log10(P-value); non-significant results (P ≥2.5×10^−6) are in grey.
Each dot in (d), (e) and (f) represents an individual patient. Box plots show the median, 25th and 75th percentiles, and values within 1.5× the interquartile range. Group differences were assessed using one-way ANOVA.
ASCVD, atherosclerotic cardiovascular disease; MASH, metabolic dysfunction-associated steatohepatitis; MRI_lvesvi, cardiac magnetic resonance imaging of left ventricular end-systolic volume index; MRI_lvef, cardiac magnetic resonance imaging of left ventricular ejection fraction; DCM, dilated cardiomyopathy; CAD, coronary artery disease; T2D, type 2 diabetes; 2hGlu, 2-hour glucose; GGT, gamma-glutamyl transferase; AST, aspartate aminotransferase; ALT, alanine transaminase; ALP, alkaline phosphatase; whradjbmi, waist-to-hip ratio adjusted for body mass index; TG, triglycerides; ffmi, fat-free mass index; BMI, body mass index; bfpct, body fat percentage; AOR, Aorta; SUF, subcutaneous fat; SKM, skeletal muscle; LIV, Liver.
Table 1.
Top kidney proteins prioritized for kidney function regulation (eGFR GWAS and pQTL integration by coloc and SMR/HEIDI).
| coloc | SMR | ||||||||||
|---|---|---|---|---|---|---|---|---|---|---|---|
| Chr | GWAS SNP |
Protein | pQTL SNP |
ALT allele |
pQTL β | pQTL P | PP.H4 | Sig. | SMR P | HEIDI P | Sig. |
| 1 | rs12239736 | ANGPTL3 | rs10889348 | T | −0.199 | 1.9E-07 | 0.999 | Yes | 3.6E-05 | 0.059 | Yes |
| 1 | rs529790 | ATP5IF1 | rs576550 | T | 0.302 | 9.6E-31 | 0.970 | Yes | 7.9E-09 | 0.777 | Yes |
| 1 | rs754984 | TCEA3 | rs1198426 | C | 0.179 | 3.4E-08 | 0.999 | Yes | 1.2E-05 | 0.115 | Yes |
| 2 | rs79154857 | ACP1 | rs62114548 | G | 0.986 | 8.5E-79 | 0.999 | Yes | 5.8E-14 | 0.167 | Yes |
| 2 | rs6432572 | PLA2R1 | rs3749117 | C | −0.397 | 1.7E-25 | 0.988 | Yes | 2.1E-07 | 0.206 | Yes |
| 2 | rs2586952 | PNPT1 | rs782606 | C | −0.091 | 6.9E-08 | 0.945 | Yes | 5.8E-05 | 0.613 | Yes |
| 2 | rs17462630 | VIL1 | rs2710246 | C | −0.180 | 2.6E-10 | 0.999 | Yes | 8.4E-06 | 0.052 | Yes |
| 3 | rs7039 | ARL6IP5 | rs3853159 | C | −0.552 | 1.5E-54 | 0.999 | Yes | 2.8E-10 | 0.201 | Yes |
| 3 | rs6764415 | GPX1 | rs9824092 | G | −0.269 | 2.9E-07 | 0.909 | Yes | 1.1E-05 | 0.441 | Yes |
| 3 | rs5029970 | KNG1 | rs5029977 | T | −0.119 | 3.7E-09 | 0.807 | Yes | 8.1E-08 | 0.053 | Yes |
| 5 | rs11242129 | LEAP2 | rs56927472 | A | 0.473 | 4.2E-11 | 0.885 | Yes | 7.6E-07 | 0.223 | Yes |
| 5 | rs2455357 | TPPP | rs413988 | G | −0.546 | 3.2E-31 | 0.999 | Yes | 1.9E-18 | 0.203 | Yes |
| 6 | rs6423287 | GSTA1 | rs9382146 | A | 0.249 | 3.0E-22 | 0.999 | Yes | 1.5E-11 | 0.067 | Yes |
| 6 | rs117103160 | MANEA | rs13192906 | G | −1.126 | 5.5E-53 | 0.985 | Yes | 2.1E-07 | 0.832 | Yes |
| 7 | rs41301394 | MDH2 | rs11982200 | C | −0.154 | 3.1E-09 | 0.999 | Yes | 1.8E-06 | 0.050 | Yes |
| 7 | rs10262162 | NUDCD3 | rs9886060 | C | −0.365 | 4.0E-18 | 0.936 | Yes | 8.1E-06 | 0.133 | Yes |
| 8 | rs10957150 | RAB2A | rs7007434 | A | 0.155 | 4.3E-09 | 0.928 | Yes | 4.6E-05 | 0.069 | Yes |
| 10 | rs7087356 | ANXA11 | rs1079242 | G | −0.209 | 8.8E-13 | 0.999 | Yes | 6.7E-06 | 0.104 | Yes |
| 10 | rs7905095 | MGMT | rs530466 | C | 0.449 | 5.1E-21 | 0.999 | Yes | 5.7E-07 | 0.318 | Yes |
| 10 | rs7087356 | PRXL2A | rs7895779 | C | −0.187 | 8.0E-08 | 0.824 | Yes | 4.9E-06 | 0.089 | Yes |
| 12 | rs11616030 | BCL2L14 | rs117412388 | A | 1.293 | 1.6E-59 | 0.999 | Yes | 9.6E-17 | 0.111 | Yes |
| 12 | rs7135314 | CCDC92 | rs112702205 | C | 0.205 | 2.7E-10 | 0.999 | Yes | 4.6E-05 | 0.339 | Yes |
| 12 | rs7964492 | INHBC | rs7971133 | T | −0.625 | 1.2E-25 | 0.875 | Yes | 3.9E-16 | 0.086 | Yes |
| 14 | rs7151920 | VTI1B | rs11624498 | G | 0.154 | 3.3E-07 | 0.884 | Yes | 6.2E-05 | 0.098 | Yes |
| 16 | rs72811597 | CHMP1A | rs258341 | C | −0.240 | 9.1E-14 | 0.999 | Yes | 1.9E-09 | 0.055 | Yes |
| 16 | rs6499165 | TPPP3 | rs34845769 | A | 0.273 | 3.9E-12 | 0.999 | Yes | 1.9E-05 | 0.051 | Yes |
| 19 | rs3111316 | GCDH | rs2293683 | G | 0.185 | 3.1E-11 | 0.999 | Yes | 9.4E-07 | 0.052 | Yes |
| 20 | rs73077077 | CPXM1 | rs58625759 | A | 0.286 | 1.1E-09 | 0.999 | Yes | 3.1E-07 | 0.662 | Yes |
| 20 | rs6105308 | FLRT3 | rs62202941 | T | 0.313 | 3.8E-11 | 0.999 | Yes | 2.3E-05 | 0.140 | Yes |
| 20 | rs6050535 | PYGB | rs4619688 | A | −0.241 | 4.3E-14 | 0.999 | Yes | 5.9E-05 | 0.050 | Yes |
| 22 | rs132651 | APOL3 | rs132631 | C | 0.241 | 7.2E-11 | 0.999 | Yes | 1.3E-07 | 0.309 | Yes |
This table displays 31 proteins that show both significant coloc and SMR/HEIDI outcomes for eGFR GWAS. The column pQTL β indicates the effect size on the ALT allele. The proteins are organized in ascending order of their chromosomal location. PP.H4 represents the posterior probability of a shared causal variant, and the higher value from either coloc.abf or coloc.susie is reported. coloc, Bayesian colocalization; SMR, summary data-based Mendelian randomization; HEIDI, heterogeneity in dependent instruments; sig., significant.
Amongst proteins not previously prioritized for kidney function, we recognized the phospholipase A2 receptor 1 (PLA2R1). Autoantibodies to PLA2R1 have been shown to cause membranous nephropathy, a rare form of nephrotic syndrome. Our eGFR GWAS in the general population identified multiple variants, including a lead variant (rs3749117: MAF=43%; T as the risk allele; C as the effect allele; β=−0.397, 95% CI: −0.466 to −0.328; P=1.7×10^−25) in the PLA2R1 gene. Integration of the GWAS signal with pQTL data indicated that the same variants also altered the kidney protein level of PLA2R1 (Fig. 2c, d). Importantly, we did not observe genotype-dependent differences in PLA2R1 transcript levels despite the strong effect of the variant on protein expression (Fig. 2c–e). We further confirmed the genotype-dependent changes in PLA2R1 levels by quantitative multiplexed mass spectrometry analysis (Fig. 2f). Our analysis indicated consistently higher PLA2R1 protein levels in kidneys of patients with the eGFR risk allele (Fig. 2g). Plasma pQTL analysis also indicated significant effects of PLA2R1 on kidney function (MR p-values: FENLAND, 2.9×10^−7; ARIC, 2.9×10^−7). To further investigate the specificity of PLA2R1’s role, we extended our analysis to 36 CKM traits (diabetes, lipids, etc.) and plasma pQTL and tissue eQTL data (Methods). We found significant tissue PLA2R1 eQTL effects at type 2 diabetes and triglycerides (TG) loci (Fig. 2h), with higher gene transcription associated with increased TG levels and type 2 diabetes risk. Similarly, higher PLA2R1 was associated with reduced kidney function. These findings suggest that PLA2R1 might be involved in broader metabolic processes, however, future studies shall exclude the effects of confounding factors.
To identify shared genetic influences of eGFR GWAS loci on both protein and RNA expression levels, we focused on genes and proteins that showed a concordant genotype effect change using moloc30, a method for multi-omics Bayesian colocalization analysis. We identified 8 regions with concordant genotype-driven gene expression and protein level changes (probability of moloc abc_PP≥0.8), which included ADP-ribosylation factor-like 6 interacting protein 5 (ARL6IP5), beta-1,4-galactosyltransferase 1 (B4GALT1), charged multivesicular body protein 1A (CHMP1A), carboxypeptidase X, M14 family member 1 (CPXM1), cathepsin S (CTSS), regulator of microtubule dynamics 1 (RMDN1), transcription elongation factor A protein 3 (TCEA3), and tubulin polymerization promoting protein (TPPP) (Extended Data Fig. 4a–c and Supplementary Table 19), suggesting a regulatory cascade from variant to RNA to protein. In summary, Bayesian colocalization prioritized proteins with shared genetic influences on protein levels, highlighting them as potential mediators of genotype effects that may contribute to kidney disease development.
Mendelian Randomization Links Genotype to Kidney Function
To identify proteins likely mediating the genotype effect on kidney disease development, we implemented summary data-based Mendelian randomization (SMR) along with the heterogeneity in dependent instruments (HEIDI) test to evaluate the potential mediation effect of cis-regulated protein abundance on the association between genetic variants and eGFR (Extended Data Fig. 5a). The HEIDI test reduces the likelihood that associations are driven by separate, linked SNVs, which could otherwise violate Mendelian randomization assumptions for causal inference. Our analysis prioritized 52 pQTL proteins and 62 eQTL genes in SMR and HEIDI analyses, indicating their potential roles as mediators in kidney function (Extended Data Fig. 5b–d, Supplementary Fig. 10, Table 1, and Supplementary Tables 18, 20, 21). Among these, 31 proteins and 42 genes had already shown concordant genetic associations in prior colocalization analyses (Extended Data Fig. 5e, f, 6, and Supplementary Tables 22, 23), supporting these proteins/genes as high-priority candidates potentially involved in kidney disease development. A large number of metabolism-related proteins were prioritized by both SMR/HEIDI and coloc, including glutathione s-transferase A1 (GSTA1), malate dehydrogenase 2 (MDH2), and glutaryl-CoA dehydrogenasemalate dehydrogenase 2 (GCDH), supporting the likely role of metabolism in kidney disease development.
We found convergent prioritized evidence for 8 GWAS loci using colocalization and SMR/HEIDI tests for gene expression and protein data. These included angiopoietin-like protein 3 (ANGPTL3), ARL6IP5, Apoptosis facilitator Bcl-2-like protein 14 (BCL2L14), CHMP1A, CPXM1, GSTA1, Methylated-DNA--protein-cysteine methyltransferase (MGMT), and TPPP (Extended Data Fig. 5g and Supplementary Tables 22, 23). Previous cell and animal model data indicated the role of CHMP1A in kidney disease development31. Multiple moloc-prioritized loci, including CHMP1A, were also prioritized by coloc and SMR/HEIDI analyses, suggesting that such loci may identify genetic variants with coordinated regulatory roles at the transcriptional and protein levels, which could identify important contributors to kidney disease pathogenesis.
Nominating eGFR Effector Cell Types
The use of whole kidney cortical samples limited the nomination of kidney disease causal cell types. To identify the origin of cell type expression of the identified proteins, we analyzed single nucleus RNA-seq data from human kidneys. We plotted the relative (z-score-based) expression of the 70 proteins prioritized through colocalization with eGFR GWAS in a heatmap (Extended Data Fig. 7a, b). Several identified proteins were enriched in specific kidney cell types. Notably, PLA2R1 and tubulin polymerization-promoting protein family member 3 (TPPP3) were enriched in podocytes, while dipeptidase 1 (DPEP1) and CHMP1A were predominant in proximal tubules. A similar cell-type enriched expression pattern was consistent even when analyzing genes associated with 52 proteins significant in both SMR and HEIDI tests (Extended Data Fig. 7c).
To further clarify the cell type expression of disease-causal proteins, we analyzed spatial transcriptomics data of human kidney samples using the Visium platform (Extended Data Fig. 8a, b). We further confirmed the expression of PLA2R1 and TPPP3 by podocytes (Extended Data Fig. 8c, d), while DPEP1 and CHMP1A were expressed by proximal tubule cells (Extended Data Fig. 8e, f). Notably, while we observed an important enrichment of eGFR-prioritized genes in proximal tubules, protein level data showed potentially greater contribution from podocytes.
Gene Prioritization for Hypertension and Kidney Function
The causal role of CKD in hypertension development has been widely recognized32. In observational studies hypertension correlated with kidney function decline and treatment of HTN showed some protection in some studies. The role and relationship between CKD and HTN have been debated33,34. GWAS could provide important insight into this causal relationship. We first employed GSMR (generalized summary-data-based Mendelian randomization)35 to assess the relationship between kidney function and SBP/DBP (systolic/diastolic blood pressure) GWAS, which considers the pleiotropic effects of multiple SNVs across GWAS datasets. The results indicated bidirectional relationships between kidney function and blood pressure, the effect sizes and significance values were greater in the direction indicating that kidney disease as a cause of hypertension (Extended Data Fig. 9a, b).
To further evaluate the shared genetic architecture of kidney function and blood pressure, we performed colocalization analyses between eGFR and SBP/DBP GWAS (coloc, PP.H4≥0.8, Fig. 3a). We identified 135 SBP and 151 DBP loci shared with eGFR GWAS loci (Supplementary Table 24). To prioritize proteins for these shared genetic loci, we performed colocalization analysis using kidney pQTLs. The analysis nominated 11 proteins for SBP and 11 proteins for DBP (Fig. 3b, Supplementary Table 25), indicating that shared genetic loci influence the levels of common proteins for blood pressure regulation and kidney function. Among these, two proteins—CHMP1A, and TPPP—overlapped with kidney eGFR risk proteins (Fig. 3c). CHMP1A levels were influenced by variants at the same genetic loci (Fig. 3d). Our GSMR analysis suggests a bidirectional genetic relationship between kidney function and blood pressure. We found common genetic signals for kidney function and hypertension. We also found that eGFR-associated variants can explain changes in SBP, most likely consistent with the role of CKD in HTN development. In addition to a lesser degree, SBP-associated variants may mediate effects on eGFR, potentially indicating an association between HTN in CKD development or progression. Overall, our combined kidney function and HTN genetic analysis indicates a shared genetic architecture of CKD and HTN, consistent with the broader concept of CKM traits.
Fig. 3. Integrated Analysis to Prioritize Candidate Proteins/Genes for Kidney Function and Blood Pressure.

(a) Colocalization analysis between eGFR and SBP/DBP GWAS and kidney pQTL proteins.
(b) Venn plot of colocalization analysis of kidney pQTL and SBP and DBP.
(c) Venn diagram illustrating the overlap of proteins significantly colocalized with SBP/DBP and eGFR. Thirty eGFR risk proteins are significant by both colocalization and SMR analyses.
(d) LocusZoom plot of eGFR GWAS, SBP GWAS, DBP GWAS, kidney CHMP1A pQTL, and kidney CHMP1A eQTL. The SNV rs164747 is highlighted as the most significant SNV for eGFR GWAS in this locus. LD information is derived from the European population data provided by the 1,000 Genomes Project.
This locus appears particularly interesting as previous cell and animal studies have suggested the causal role of DPEP1 and CHMP1A in kidney dysfunction at this locus31. Our pQTL and eGFR SMR analysis confirmed the potential role of CHMP1A and DPEP1 in kidney function; however, the role of these genes in blood pressure regulation has not been studied. Additional studies, including fine mapping and variant-level analysis, will be essential to understand the role of genetic variants in kidney disease development and blood pressure regulation. Overall, our combined kidney function and hypertension genetic analysis indicates a shared genetic architecture of hypertension and CKD.
GWAS and QTL Integration Highlights Kidney Proteins in CKM
To prioritize effector proteins in human kidney samples for CKM, we analyzed 36 CKM GWAS traits including obesity, diabetes, atherosclerotic cardiovascular disease (ASCVD), CKD, and metabolic dysfunction-associated steatohepatitis (MASH) (Methods). We prioritized effector proteins by integrating colocalization and Mendelian randomization for kidney pQTLs, eQTLs, and plasma pQTLs (Methods and Fig. 1a, 4a, b). A total of 151 prioritized protein-outcome pairs (90 proteins and 26 outcomes) were significant in both analyses, where 22 proteins were associated with more than one outcome, and 8 proteins showed associations across multiple categories (Supplementary Table 26). Of the 151 protein-outcome pairs, 89 were unique to kidney pQTLs compared to kidney eQTLs or plasma pQTLs (Table 2, Supplementary Table 26, 27, and Fig. 4c).
Fig. 4. Prioritizing Candidate Proteins/Genes for CKM GWAS Traits through Colocalization and Mendelian Randomization.

(a) Bayesian colocalization analysis of the 36 CKM GWAS traits with kidney pQTL/eQTL and plasma pQTL data.
(b) Schematic representation of Mendelian randomization analysis between kidney pQTL/eQTL, plasma pQTL, and 36 CKM GWAS.
(c) Venn diagrams showing the number of significant QTL-GWAS pairs identified through colocalization and Mendelian randomization across kidney pQTL, kidney eQTL, and plasma pQTL. When multiple protein/gene-outcome pairs were observed within the same QTL modality, duplicates were removed and treated as unique pairs.
(d) LocusZoom plots displaying the association signals for the IL6R gene with kidney pQTL/eQTL, plasma pQTL and CAD GWAS. The lead variant rs4845619 from kidney pQTL is indicated.
(e) SMR-derived statistics (Beta and Pval) linking the kidney function associated genetic variant to renal ANGPTL3’s gene expression and protein abundance. The reported Beta and Pval values correspond to the top variants identified for eQTL and pQTL, respectively.
(f) LocusZoom plots showing eGFR, LDL-C, HDL-C, and TG GWAS, kidney pQTL, kidney eQTL, and plasma pQTL at the ANGPTL3 locus. The lead variant rs12239736 from the eGFR GWAS is indicated, with its −log10(p) values plotted against genomic positions for each trait. The PP is 0.76 for eGFR, LDL-C, and TG GWAS, indicating a significant shared genetic background among the traits at this locus. Kidney pQTL and eQTL plots are also shown with the coloc PP.H4 values for eGFR, LDL-C and TG GWAS.
PP.H4 values represent colocalization probabilities estimated using coloc, while PP values are derived from HyprColoc analysis. Colocalization analyses for lipid traits in this panel were performed using GWAS summary statistics from Graham et al.54.
LD information is derived from the European population data provided by the 1,000 Genomes Project. The plasma pQTL data are derived from the FENLAND cohort.
Abbreviations: MR, Mendelian randomization; GSMR, generalized summary-data-based Mendelian randomization; CKM, cardiovascular-kidney-metabolic; PP, posterior probability; CAD, coronary artery disease; LDL-C, low-density lipoprotein cholesterol; HDL-C, high-density lipoprotein cholesterol; TG, triglyceride.
Table 2.
Top kidney proteins prioritized for CKM (CKM GWAS and pQTL integration by coloc and MR).
| Protein | Outcome | Category | pQTL P | GWAS P | coloc PP | MR β | MR P |
|---|---|---|---|---|---|---|---|
| APOH | GGT | MASH | 1.2E-20 | 1.4E-08 | 0.994 | 0.040 | 8.2E-06 |
| APOL3 | ALP | MASH | 7.2E-11 | 2.4E-37 | 0.964 | 0.183 | 3.7E-36 |
| C1S | Myocardial_infarction | ASCVD | 1.9E-12 | 2.1E-05 | 0.893 | 0.196 | 2.1E-05 |
| CHMP1A | DBP | CKD | 9.1E-14 | 2.9E-08 | 0.994 | 0.058 | 2.9E-08 |
| CPPED1 | Urea | CKD | 4.7E-48 | 2.8E-08 | 0.918 | −0.023 | 3.7E-08 |
| CYTL1 | ffmi | Obesity | 2.0E-10 | 1.1E-10 | 1.000 | −0.071 | 1.1E-10 |
| FAS | AST | MASH | 5.8E-07 | 1.7E-08 | 0.928 | −0.098 | 3.3E-08 |
| GBA3 | Urate | CKD | 6.2E-29 | 4.4E-14 | 0.981 | 0.044 | 7.5E-14 |
| GMPR | Hip_circumference | Obesity | 1.1E-61 | 6.3E-08 | 0.924 | −0.016 | 2.7E-07 |
| HAGHL | Hip_circumference | Obesity | 2.4E-15 | 3.9E-12 | 0.968 | 0.051 | 1.3E-11 |
| HOGA1 | Urea | CKD | 1.5E-09 | 1.7E-06 | 0.960 | −0.067 | 2.4E-06 |
| IL18R1 | Urate | CKD | 5.2E-30 | 2.3E-08 | 0.927 | 0.028 | 1.1E-07 |
| IL6R | CAD | ASCVD | 4.4E-11 | 4.4E-22 | 0.948 | −0.226 | 2.6E-21 |
| INHBC | CAD | ASCVD | 1.3E-25 | 3.9E-09 | 0.957 | 0.051 | 1.0E-08 |
| MANEA | eGFR | CKD | 5.5E-53 | 1.3E-06 | 0.911 | 0.009 | 2.0E-06 |
| MAP2K1 | BMI | Obesity | 3.3E-10 | 9.0E-09 | 0.912 | 0.085 | 2.0E-07 |
| MGMT | bfpct | Obesity | 5.1E-21 | 1.0E-07 | 0.898 | 0.019 | 4.5E-05 |
| MST1 | eGFR | CKD | 2.8E-52 | 1.6E-18 | 0.870 | −0.014 | 3.4E-17 |
| NUCB2 | whradjbmi | Obesity | 1.1E-12 | 1.4E-10 | 0.968 | −0.046 | 3.4E-10 |
| OAF | DBP | CKD | 2.1E-14 | 2.8E-07 | 0.978 | 0.048 | 3.3E-07 |
| PKN2 | MRI_lvef | ASCVD | 2.4E-10 | 5.4E-08 | 0.890 | 0.278 | 1.3E-07 |
| PNP | ALP | MASH | 1.8E-19 | 3.6E-07 | 0.918 | −0.057 | 1.3E-05 |
| SHARPIN | BMI | Obesity | 3.3E-13 | 1.9E-07 | 0.906 | 0.059 | 6.6E-06 |
| SIGLEC9 | ALT | MASH | 2.5E-41 | 4.2E-08 | 0.988 | −0.018 | 5.9E-08 |
| SIRPA | T2D | Diabetes | 6.1E-91 | 1.3E-08 | 0.878 | −0.019 | 3.0E-09 |
| SMOC1 | DBP | CKD | 1.2E-09 | 5.9E-08 | 0.968 | −0.050 | 2.4E-07 |
| SNX16 | SBP | CKD | 6.8E-11 | 7.0E-09 | 0.936 | 0.069 | 2.6E-08 |
| SPATA20 | SBP | CKD | 9.4E-45 | 1.5E-07 | 0.919 | 0.017 | 3.2E-06 |
| TRPT1 | Waist_circumference | Obesity | 6.7E-21 | 1.4E-07 | 0.921 | 0.026 | 2.6E-06 |
| TSEN15 | ffmi | Obesity | 2.8E-66 | 1.1E-11 | 0.987 | 0.020 | 1.1E-11 |
This table displays the Mendelian randomization (MR) estimates and posterior probability (PP) of genetic colocalization (coloc) of kidney pQTLs vs. GWAS of top 30 different cardiometabolic outcomes, as determined by the highest coloc PP value for each protein. Only the combination with the highest PP value is shown for proteins with multiple significant outcomes. All these protein-outcome pairs are deemed significant (Methods). Outcome, GWAS trait used.
ALP, alkaline phosphatase; ALT, alanine transaminase; ASCVD, atherosclerotic cardiovascular disease; AST, aspartate aminotransferase; CAD, coronary artery disease; DBP, diastolic blood pressure; ffmi, fat-free mass index; GGT, gamma-glutamyl transferase; MASH, metabolic dysfunction-associated steatohepatitis; SBP, systolic blood pressure; T2D, type 2 diabetes; whradjbmi, waist-to-hip ratio adjusted for body mass index.
Among these effect mediators not previously prioritized, the kidney IL-6 receptor (IL6R) showed unique associations with coronary artery disease (CAD) (Posterior probability=0.95; Fig. 4d), and also supported by Mendelian randomization (MR p-value=2.6×10^−21). Furthermore, Mendelian randomization analysis for plasma IL6R pQTL indicated a potential role in the development of CAD (the lowest MR p-value being 4.1×10^−18), but this association was not observed by colocalization (the highest posterior probability being 0.03). IL6R has not been identified as a kidney eQTL gene3,4,7, colocalization and SMR analysis of kidney IL6R pQTL and eGFR was not significant (PP.H4=0.04, p-value=0.02, respectively), indicating that the effect of kidney IL6R on CAD may not be mediated through kidney function.
ANGPTL3 is a protein that plays a crucial role in lipid metabolism. ANGPTL3 inhibits the activity of LPL, which is necessary for the breakdown of TG in very low-density lipoproteins (VLDL) and chylomicrons36,37, causing elevated TG levels. The role of ANGPTL3 has been identified in TG, high-density lipoprotein cholesterol (HDL-C), and low-density lipoprotein cholesterol (LDL-C) in GWAS and animal model studies. Our genetic, genomic, and proteomic analysis nominated ANGPTL3 as a prioritized protein for kidney function (eGFR) (Fig. 4e). Kidney disease is associated with lipid abnormalities, including high cholesterol and TG levels. Lipid abnormalities have also been proposed to cause CKD. To assess the relationship between kidney function and lipid levels, we performed GSMR analysis, which demonstrated a significant effect of LDL-C on eGFR and eGFR on HDL-C. We identified significant bidirectional effects between TG and eGFR. However, the effects of HDL-C on eGFR and eGFR on LDL-C were not statistically significant (Extended Data Fig. 9c, d). Additionally, colocalization analysis demonstrated significant overlap among eGFR, LDL-C, HDL-C, and TG GWAS with a posterior probability of 0.76 at the ANGPTL3 locus (Fig. 4f), indicating that genetic variants at this locus influencing lipid levels may also impact kidney function. Furthermore, ANGPTL3 kidney pQTL/eQTL showed significant colocalization with eGFR GWAS (pQTL PP.H4=0.99, eQTL PP.H4=0.99), LDL-C GWAS (pQTL PP.H4=0.95, eQTL PP.H4=0.93), and TG GWAS (pQTL PP.H4=0.88, eQTL PP.H4=0.89) (Fig. 4f), suggesting a shared genetic association between kidney function, lipids, and ANGPTL3. To further contextualize these associations, we performed a comprehensive colocalization analysis across multiple cardio-kidney-metabolic traits and integrated Mendelian randomization (Extended Data Fig. 10a, b). This result highlights the pleiotropic nature of ANGPTL3 across lipid and eGFR traits, indicating its potential biological relevance.
In summary, these findings underscore the role of kidney proteins in understanding CKM development.
Druggability in Kidney and CMK Disease Treatment
We next used the Drug Gene Interaction Database (DGIdb)38 to identify potential drugs for CKM, given the large number of discovered protein targets. Our analysis identified 32 proteins that could be targeted by already approved drugs (Supplementary Table 28). Among the proteins not previously prioritized, several showed potential therapeutic relevance. For instance, DPEP1, previously prioritized for its potential role in kidney disease, can be targeted by cilastatin.
To further evaluate the therapeutic potential of the identified proteins we employed the DrugnomeAI tool39, a stochastic, semi-supervised machine learning framework that assesses druggability across various modalities, including small molecules, antibodies, and proteolysis targeting chimeras (PROTACs). DrugnomeAI identified many proteins with high druggability probability (percentile scores >90, Supplementary Table 29). One such protein is a disintegrin and metalloproteinase 17 (ADAM17), which exhibited high scores for small molecules (97.51), antibodies (98.53), and PROTACs (98.16). Despite its promise, no approved drugs currently targeting ADAM17, highlighting a significant opportunity for drug development.
Overall, our analysis highlighted key targetable kidney proteins for CKM, offering promising avenues for therapeutic intervention.
Discussion
This study presents the comprehensive proteogenomics (pQTL) analysis of human kidneys, highlighting the potential role of genetically regulated protein changes in renal function and CKM. We defined CKM traits by selecting a broad range of metabolic and vascular outcomes relevant to kidney and cardiovascular health, where CKM serves as a conceptual framework to investigate overlapping genetic signals among metabolic, cardiovascular, and renal traits and diseases. This approach allows us to examine both overlapping and distinct proteins/genes associated with CKM-related traits, offering insights into shared regulatory mechanisms and trait-specific functions within the CKM spectrum. We performed a comprehensive integration that included Mendelian randomization and genetic colocalization of 36 CKM GWAS traits and kidney pQTL and eQTL data. Our findings demonstrate that kidney protein levels represent an important dimension not captured by plasma proteins and kidney gene expression. Our integrative methods identified proteins for CKM, including proteins and genes that play roles in multiple traits, such as hypertension and kidney function, and those with a confluence of evidence from genetic variants to gene expression and protein levels. Furthermore, our integrative analysis, which included not only kidney GWAS but also 36 CKM traits, allowed us to dissect genetic regions that influence multiple phenotypes, including blood pressure and lipid levels. By highlighting the complexity and interconnectedness of CKM, our study underscores the importance of considering multiple layers of biological regulation. The identification of protein targets and pathways offers promising avenues for therapeutic intervention and provides a more nuanced understanding of CKM pathogenesis. This work sets the stage for future research to explore the clinical implications of these findings and to develop targeted therapies that can address the underlying molecular mechanisms of CKM.
There are several key proteins to highlight from our study due to their likely immediate clinical impact. Autoantibodies against PLA2R1 are the primary cause of membranous nephropathy, a rare form of nephrotic syndrome. Genetic variants in PLA2R1 predispose patients to developing membranous nephropathy. We identified rs3749117, a membranous nephropathy risk variant40, as a kidney function risk variant associated with increased PLA2R1 protein levels (β = 0.397 for the T allele) both in the SomaScan and the mass spectrometry data. This finding is consistent with previous plasma pQTL studies, including Pietzner et al.41 (β = 0.624 for the T allele) and Sun et al.15 (β = 0.9 for the T allele), indicating higher PLA2R1 levels in individuals with T allele. Moreover, our recent meta-analysis of eGFR GWAS involving over 2.2 million individuals29 consistently identified rs3749117-T as the risk allele for reduced eGFR, further indicating evidence for its biological relevance. Membranous nephropathy develops by autoantibody formation to PLA2R1, but the mechanism of autoantibody formation is unclear42. Since the key GWAS signal (rs3749117) is a missense PLA2R1 variant according to VEP, and the T allele is protective for eGFR, we cannot exclude the possibility that structural variation in PLA2R1 potentially contributes to autoantibody production43. While prior eQTL studies failed to detect colocalization between eGFR GWAS and PLA2R1 gene expression3, our pQTL analysis indicated a marked effect of the variant on PLA2R1 protein levels. This suggests that factors beyond gene expression, such as differences in translation efficiency, mRNA stability, and protein turnover may play a role in regulating protein abundance. Additionally, PLA2R1 is a membrane-associated receptor, and the detected pQTL effect might reflect genetic regulation of circulating protein levels rather than direct transcriptional control in the kidney. Overall, our data suggest that higher PLA2R1 protein expression in the kidney may be associated with increased susceptibility autoantibody production and contribute to disease development. This hypothesis is supported by the observed correlation between renal PLA2R1 expression and PLA2R1 antibody levels in membranous nephropathy patients44. It is unclear whether the GWAS signal originates from the rare cases of membranous nephropathy or if there is a broader role for PLA2R1 in kidney function. PLA2R1 plays roles in cell proliferation, growth, differentiation, and apoptosis45, and is associated with cellular senescence and damage46. Most importantly, our comprehensive analysis prioritized PLA2R1 for multiple conditions, including elevated TG levels and type 2 diabetes, potentially indicating a pleiotropic role for PLA2R1.
In our study, we provide an important first step to dissect the genetic pleiotropy of kidney function-related traits such as hypertension, hyperlipidemia and CKM framework. Our integrative analysis identified 151 kidney pQTL proteins associated with at least one CKM-related trait. Notably, 22 proteins exhibited associations across multiple CKM categories, while most proteins were linked to only one CKM trait, highlighting the heterogeneous yet interconnected nature of CKM traits. These findings also suggest that while some proteins may mediate shared mechanisms, the modest overlap indicates that CKM traits often arise from distinct genetic pathways. Whether CKM reflects a true syndrome or a conceptual grouping of related conditions remains unclear. CKD and hypertension are interconnected phenotypes most commonly observed together. We identify genetic loci associated with both traits. We identified the likely bidirectional relationship between blood pressure and kidney function. We prioritize genes and proteins such as CHMP1A that colocalize with both for kidney function and blood pressure regulation. However, the exact causal relationship between hypertension and CKD remains unclear, and contributions from pleiotropy or mediation through other pathways cannot be ruled out. Cell and animal model experiments and further genetic dissection of such loci will be essential for understanding CKM and therapeutics development.
Our integrative analysis highlighted ANGPTL3 and IL6R, proteins previously implicated in lipid metabolism and cardiovascular disease, but here newly associated with kidney traits in a tissue-specific context. For ANGPTL3, we observed both colocalization and Mendelian randomization with eGFR using kidney pQTL data, suggesting a potential role in kidney function beyond its known involvement in lipid regulation. Experimental studies using mouse and cell model studies have indicated the role of ANGPTL3 in podocytes, CKD47, and acute kidney injury48. IL6R, although previously studied in the context of circulating protein levels and coronary artery disease49,50, showed significant kidney pQTL associations with CAD in our analysis. These findings suggest that both ANGPTL3 and IL6R may exert broader organ-specific effects than previously appreciated, and underscore the value of tissue-level proteogenomic analysis in refining disease biology.
The importance of our study lies in providing a confluence of evidence from genetic variants to gene expression and finally to protein level data to disease development. We prioritized 31 kidney proteins through colocalization and SMR/HEIDI analysis for kidney function (eGFR). These proteins include CHMP1A31 that has been shown to have causal effects on renal function and fibrosis in animal models, supporting and validating the computational analysis. For example, we identified ACP19–11,21 and INHBC9–11,21 in our kidney pQTL analysis, but they were not previously seen in kidney eQTL analysis3,7. INHBC, in particular, has been reported to have increased expression in the diabetic nephropathy rat mode51 and patients52, and to precede CKD progression in the African American Study of Kidney Disease and Hypertension (AASK)53. These results indicate that protein expression analysis provides orthogonal information for kidney function analysis.
Regulatory mechanisms can be complex and highly tissue-specific, as reflected in previous studies on heart24 and liver25 tissues, where pQTL and eQTL overlap has also been low. In this context, overlapping pQTL and eQTL signals in kidney tissue (i.e., moloc-positive loci) may suggest variants with a more direct involvement in disease processes, potentially highlighting key genes relevant to kidney disease pathogenesis.
While our study highlights the critical and unique insights provided by protein data analysis, several limitations should be considered. First, proteomics tools, used here, do not provide full proteome-wide coverage. The SomaScan platform, primarily designed for plasma protein quantification, is not specifically tailored for kidney-specific proteins, limiting detection of kidney-specific proteins. Additionally, the platform’s assay-specific binding affinities, potential epitope effects may restrict capturing the full complexity of the proteome, and comparison with existing proteomic databases indicates that this dataset does not comprehensively cover all known kidney-expressed proteins. More broadly, affinity-based methods like SomaScan and Olink depend on binding reagent specificity, whereas mass spectrometry quantifies proteins through direct peptide measurement, leading to methodological differences that influence protein detection and quantification (total vs proteoforms). Another key limitation is the lack of replication for our tissue-specific pQTL associations in an independent cohort. Given the sample size, dividing the data into separate discovery and replication cohorts was not feasible, the inclusion of known covariates and PEER factors partially address confounding effects. Moreover, while our study employed rigorous integrative approaches—including colocalization and Mendelian randomization—to prioritize putative effector proteins, we did not perform new functional validation experiments. As such, the biological mechanisms linking the identified proteins to CKM outcomes remain to be experimentally confirmed. Further in vivo and in vitro studies will be essential to elucidate causality and assess therapeutic relevance. Statistical power is another limitation of the work. The residual influence of cancer and ischemia on protein profiles cannot be fully excluded. While validation in other cohorts would enhance generalizability, obtaining high-quality, non-tumor kidney tissue suitable for large-scale proteomics remains a major challenge due to sample availability, protein yield limitations, and technical constraints. We utilized a trans-ancestry dataset (87% European ancestry) with a secondary European-only analyses. To prioritize potential CKM protein/gene mediators, we employed the Wald-ratio method, selecting the top cis-QTL at each locus for consistent comparisons across 36 diverse GWAS datasets. By restricting our analysis to signals significant in both colocalization and Mendelian randomization, we aimed to enhance rigor and reduce false positives in this large-scale context. Nevertheless, we acknowledge that our approach does not fully address potential biases inherent to Mendelian randomization analyses. In particular, differences in GWAS sample size, ancestry composition, and study design across the 36 included outcomes may introduce selection bias, potentially influencing the prioritization of CKM mediators. Across our analyses, certain limitations remain: in colocalization, challenges such as tissue-bystander effects complicate interpretation. In Mendelian randomization, issues like pleiotropy, reverse causation and confounding may also limit the robustness of causal inference across analyses, especially when associations arise from overlapping traits that may reflect indirect relationships.
In summary, we present the comprehensive analysis of human kidney proteins to inform kidney and cardio-kidney-metabolic diseases. We nominate a large number of proteins not previously prioritized for CKM, many of which could be immediately targetable by drug repurposing to advance much-needed personalized medicine for patients with CKM.
Methods
Human kidney samples
Kidney tissue samples for this study were procured from surgical nephrectomies. We ensured that only the normal parts of the tissue, specifically those at least 2 cm from any cancerous lesions, were utilized for analysis. An honest broker de-identified the samples and collected corresponding clinical information such as age, race, gender, and diabetes and hypertension status, in addition to creatinine values. The eGFR, determined using the latest CKD-EPI equations14, represents values at the time of collection. Our kidney samples were collected within a relatively short time frame (under 3 years), which likely minimizes the impact of sample age on protein levels. The use of these samples and data was approved by the institutional review board of the University of Pennsylvania under the category of “exempt,” negating the need for informed consent due to the de-identified nature of the study samples.
Kidney tissue Proteomics and data processing
Kidneys were removed, immediately snap-frozen in liquid nitrogen, and then stored at −80°C until homogenization. Tissue was cryopulverized using a CryoMill (Retsch, Haan, Germany), and protein was extracted using a lysis buffer of T-PER tissue protein extraction reagent (Thermo Fisher Scientific, Waltham, MA, USA) containing protease inhibitors (Complete; Roche Diagnostics, Basel, Switzerland). Protein concentrations were measured using bicinchoninic acid (BCA) protein assay (Pierce; Thermo Fisher Scientific). Then, we used the SomaScan assay v4.1 platform (SomaLogic, Boulder, CO, USA) for proteomics, where 7,596 targeted proteins or protein complexes in the dataset (n=337 subjects) were measured. The SomaScan platform technology and its performance characteristics have been previously described22,55,56. We followed the standard SomaScan protocol, incorporating multiple QC measures to ensure the accuracy and reliability of the obtained data55. This assay, conducted in a single batch, utilizes slow off-rate modified DNA aptamers (SOMAmers) for binding to specific protein targets with high sensitivity and specificity. To ensure consistency and reliability in the generated proteomic data, twelve hybridization control SOMAmer reagents were added to each well during the elution step to monitor variability in the hybridization and detection processes. Batch effects were accounted for, and the assay was calibrated on a per-plate basis using five pooled calibrator replicates per 96-well plate. Additionally, three pooled QC replicates, matched to the sample matrix, were included on each plate to assess precision and accuracy, while three buffer-only replicates were incorporated to monitor background signals and prevent contamination, three buffer-only replicates were also incorporated in each run. These QC measures ensure consistency and reliability in the generated proteomic data. It allows for the precise quantification of protein levels in terms of relative fluorescence units, measuring 7,288 human protein analytes (Supplementary Table 30). In our analysis, a subset of 6,903 protein analytes corresponding to chromosomes 1 through 22 was utilized for the pQTL analysis (Supplementary Table 29), where aptamers capable of binding to multiple proteins were excluded to ensure specificity. We assessed the reported expression of these 6,903 proteins in kidney tissue using two established resources (Supplementary Table 11). The immunohistochemistry-based Protein Atlas protein dataset was downloaded from the Protein Atlas database (https://www.proteinatlas.org/about/download). For the Protein Data Commons (PDC) dataset, we used PDC00046457, a publicly available mass spectrometry-based kidney proteomics resource from the Clinical Proteomic Tumor Analysis Consortium (https://pdc.cancer.gov/pdc/study/PDC000464).
To control for variability across kidney extracts, calibrator and buffer samples were incorporated into a 96-well plate format. Quality control measures were implemented according to the manufacturer’s guidelines at both the sample and SOMAmer levels. For samples, hybridization controls were utilized, and for SOMAmers, control aptamers were employed for data normalization and calibration purposes. Initially, sample data underwent normalization to mitigate within-run hybridization variability. This was followed by intra-study median normalization, to adjust for biases between samples by scaling each sample to the median signal of the study. Through this rigorous quality control process, 334 samples were deemed suitable for inclusion in the study. Principal component analysis (PCA) was performed to detect outliers. This process targeted individuals deviating more than three standard deviations from the mean of the first two principal components, resulting in the exclusion of nine individuals. Following this exclusion criterion, a total of 325 samples remained and were considered valid for the pQTL analysis.
Protein expression was also measured using the Olink Explore HT platform, specifically for the top 10 pQTL proteins, including SIRPA, PLXNB2, ACP1, and ABO. The Olink platform utilized the antibody-based proximity extension assay (PEA)58 and presented results in Normalized Protein eXpression (NPX) units. Correlation analyses were performed to compare overlapping analytes between the Olink and SomaScan platforms.
In addition to our analyses with the SomaScan and Olink platforms, we further explored proteomics through liquid chromatography-mass spectrometry (LC-MS). This allowed us to examine 9 of the top 10 pQTL proteins (SIRPA, PLXNB2, ACP1, ERAP2, ABO, THEM4, GSTZ1, TSEN15 and TAPBPL). Our LC-MS protocol, inspired by the state-of-the-art methodologies detailed in a recent publication, encompasses advanced techniques for peptide analysis and quantification characteristic of quantitative multiplexed mass spectrometry, utilizing an Orbitrap Eclipse mass spectrometer59. Key to our approach is peptide identification and quantification, enhanced by a real-time search strategy for improved detection accuracy. The protocol includes comprehensive steps from peptide separation on a microcapillary column to specific mass spectrometry settings, all tailored to our research needs while adhering to strict quality control standards. This adherence to quantitative multiplexed mass spectrometry principles ensures the high fidelity of our protein quantification.
Kidney tissue RNA-seq and data processing
RNA isolation, sequencing and analysis were performed as previously published4,22. Total RNA was isolated from kidney tissue using the RNeasy mini kit (Qiagen, Venlo, Netherlands) according to the manufacturer’s instructions, including the DNase digestion step. RNA quality was assessed by Agilent Bioanalyzer 2100. The cDNA library was prepared using NEBNext Ultra II RNA Library Prep Kit for Illumina. Then, cDNA libraries were sequenced on an Illumina NovaSeq 6000 platform using the NovaSeq PE150 protocol. Adaptor and lower quality bases were trimmed with TrimGalore (version 0.4.5). Reads were aligned to the human genome (hg19) using STAR (v2.7.3a). Gene and isoform expression levels of transcripts per million (TPM) were estimated using RSEM (v1.3.0). Of the 337 study participants, kidney tissue RNA-seq data were available for 323 participants. We analyzed genes with TPM greater than 0.1 in at least 20% of subjects, resulting in 22,053 genes. We selected a subset of genes that correspond to chromosomes 1 through 22, resulting in a total of 21,538 genes being analyzed. We assessed the expression of these genes in kidney tissue using two established transcriptomic resources (Supplementary Table 12). RNA expression data for both the Protein Atlas and GTEx were obtained from the Protein Atlas database (https://www.proteinatlas.org/about/download). Genes were considered kidney-expressed if their TPM values were detectable in either dataset. We excluded eight individuals from transcriptomic analysis based on PCA outlier detection, where we removed all individuals who deviated by more than three standard deviations from the mean of the first two principal components.
Whole genome sequencing and variant calling
DNA was extracted from kidney tissue using the DNeasy blood and tissue Qiagen kit (QIAGEN) according to the manufacturer’s instructions, then quantifed by Qubit. DNA samples were sequenced on the IlluminaTM NovaSeq platform. Whole genome sequencing data underwent a streamlined pipeline for high-quality variant discovery, achieving a minimum sequencing depth of 10x for comprehensive coverage. Quality control was rigorously applied to maintain data integrity, followed by alignment to the human reference genome hg38 using the Burrows-Wheeler Aligner (BWA) v0.7.1760. Samtools v1.861 and Picard tools v2.18.962 were then utilized for post-alignment processing, preparing the data for accurate variant analysis.
Base quality score recalibration (BQSR) was performed according to Genome Analysis Toolkit (GATK) best practices v4.4.0.063, leveraging widely recognized variant databases such as dbSNP build 13864, Illumina HumanOmni2.5-Quad v1.0 BeadChip array65, HapMap 3.366, and the 1,000 Genomes Project phase 1 high confidence SNPs67, alongside known Indel references from the Mills and 1,000 Genomes gold standard indels68. Variant calling, the core of the genetic variation analysis, was adeptly handled by GATK’s HaplotypeCaller63, with joint genotyping facilitated by GenotypeGVCFs. This approach allowed for the accurate identification of both single nucleotide variants (SNVs) and insertions/deletions (InDels). High-confidence variants were ensured through the application of variant quality score recalibration (VQSR), adhering to GATK’s recommended practices, with a minimum sequencing depth (DP) of 10x and a genotype quality (GQ) threshold of 20 applied to filter low-confidence variants. In total, 47,440,526 SNVs were identified on autosomes, with the overall dataset, including sex chromosomes, comprising 49,181,924 SNVs. For each SNV, the A1 (alternative allele) and A2 (reference allele) designations were aligned with the annotations provided by dbSNP (release v.151)64, ensuring consistency in allele representation across our genomic dataset.
Genotype data quality control
Standard GWAS QC was applied at both individual and autosomal SNV levels. SNVs were filtered out if missingness was higher than 5%, they had a MAF less than 1%, or if the significance level for the Hardy-Weinberg equilibrium (HWE) was less than 1 × 10⁻⁶. In addition, samples were removed in the case of across-SNV call rate less than 95%, sex mismatch, and cryptic relatedness, as assessed by identity by state more than 0.8. To quantify population structure, PCA was conducted using PLINK on the final 328 samples, with additional genotype data from 2,504 samples from the 1,000 Genomes Project Phase 1 (release v3, 661 AFR, 347 AMR, 504 EAS, 503 EUR, 489 SAS)67. A merged dataset was obtained from our WGS data and the 1000 Genomes Project data. Variants located in long-range LD regions69 were excluded, followed by the application of a MAF threshold of 0.05. LD pruning was then performed with a sliding window size of 50 variants, a step size of 5 variants, and an r2 threshold of 0.2 (--indep-pairwise 50 5 0.2), resulting in a final set of 508,707 variants used for PCA. Ancestry principal component analysis was well aligned with 1,000 Genomes Project Phase 1 findings, as illustrated in Supplementary Fig. 11. Consequently, all samples met the criteria for inclusion in further analyses. After QC, 13,333,246 SNVs and 328 subjects remained (Supplementary Table 2), and the data were compiled into a variant call format (VCF) file, which included genotypes for alternative allele counts for use with the QTLtools software packages. The QC and filtering processes were conducted using PLINK (version 1.90)70.
Cis-pQTL mapping and analysis
To identify associations between SNVs and expression of proteins within a ±1-Mb window of the queried protein TSS, pQTL analysis was performed using a linear regression model implemented in 321 human kidney samples using the QTLtools (v1.3.1) package71. Log2 transformation was performed on protein expression values, and then expression measurements for each protein were rank-based inverse normal transformed. In order to eliminate the effects of unobserved confounding variables, PEER72 was performed in 50 factors on protein expression with age, gender, collected site, eGFR and top five genotype PCs as covariates (Supplementary Fig. 1a). The Pearson correlation P between known clinical variables and 50 PEER factors are shown in Supplementary Fig. 1b. To correct for multiple testing across all proteins, we used the q-value R package73 on the adjusted protein-level P values obtained from 1,000 permutations and significance was assessed at 5% FDR (q-value<0.05) to identify genes with at least one significant cis pQTL (“pQTL proteins”). The genomic inflation factor lambda had a median of 1.00 (95% confidence interval: 0.995 to 1.005) across 6903 proteins, indicating minimal inflation and appropriate control of confounding factors. Moreover, all protein-SNV pair relationships determined in nominal mode were considered significant at a protein-level FDR<0.05.
cis-SNV heritability estimation
cis-SNV heritability (cis-h2) for each protein was estimated using the REML algorithm74 implemented in GCTA (v1.94.1)75. We used all variants within a 1-Mb window around each significant pQTL (protein-level FDR < 0.05) without LD pruning, consistent with the cis-pQTL analysis approach. Heritability estimation was performed across all 873 significant pQTL proteins, and the resulting cis-h2 values were averaged to obtain an overall cis-h2 estimate from these 873 pQTLs.
Consideration of additional covariates for cis-pQTL analysis
To validate our identified pQTL signals, we assessed the potential inclusion of additional covariates, specifically sample age (time from collection to measurement), diabetes mellitus, and hypertension. Our kidney samples were collected within a relatively short time frame (under 3 years), which likely minimizes the impact of sample age on protein levels. Nonetheless, given that a previous study17 indicated that sample age can influence plasma protein levels, we also evaluated its potential effect as a covariate to ensure the robustness of our results, where 50 PEER factors were used (Supplementary Fig. 12a).
European population-specific cis-pQTL mapping and analysis
To assess cis-pQTLs within the European population subset, we conducted the analysis in the same manner as the primary cis-pQTL analysis, using 60 PEER factors to account for confounding variables (Supplementary Fig. 12b). All other aspects of the analysis followed the same approach as described in the primary analysis.
Sex-specific cis-pQTL analysis
We conducted sex-specific cis-pQTL analyses, following the same approach as in the primary analysis. First, we examined proteins encoded by genes located on the X chromosome. For this analysis, the number of minor alleles was coded as 0 or 2 for homizygous males and 0, 1, or 2 for females to account for sex-specific differences in allele representation76. Following the X chromosome analysis, we performed separate analyses for males and females on the 22 autosomes to investigate sex-specific effects. In these analyses, we used 50 PEER factors for males and 25 PEER factors for females to control for potential confounding variables (Supplementary Fig. 11c and 11d).
Rare variant analysis
Rare genetic variations (0.1%<MAF<1%) were analyzed for cis associations using the Sequence Kernel Association Test Optimal (SKAT-O) method implemented in the SKAT package77 of R software. After applying the same QC filters as in the common variant analysis, 24,597,957 rare variants were used. SKAT-O integrates the strengths of burden tests and kernel association tests by collapsing rare variants within a specific protein. Only rare variants annotated by SnpEff78 v4.1 with a high effect impact were selected for analysis. These cis variants were collapsed and tested for their association with the protein levels encoded by the respective genes. Associations were considered significant if they achieved a FDR of less than 0.05.
Trans-pQTL mapping and analysis
To explore associations between SNVs and protein expression located outside the ±1-Mb window from the queried protein TSS, trans-pQTL analysis was also performed using QTLtools (v1.3.1)71. The same preprocessing steps and covariates as in the cis-pQTL analysis were applied. The Bonferroni correction threshold (P < 7.24×10^−12) was determined by dividing the genome-wide significance threshold (P<5×10^−8) by the total number of tested proteins (6903) to control for multiple comparisons.
Ligand receptor interaction analysis
To explore potential ligand-receptor interactions among the identified pQTL proteins, we obtained the ligand-receptor list from the comprehensive CellTalkDB database20. Out of the 873 significant cis-pQTLs (representing 804 unique proteins), we identified 71 ligands and 52 receptors. By cross-referencing these ligands and receptors, we found a total of 19 ligand-receptor pairs within our dataset. Then, we evaluated these 19 ligand-receptor pairs to determine whether they exhibited significant signals in trans-pQTL analysis, where we applied a nominal p-value threshold of 1×10^−5 to identify protein-SNV pairs.
Cis-eQTL mapping and analysis
To identify associations between SNVs and expression of genes within a ±1-Mb window of the queried gene TSS, eQTL analysis was performed using a linear regression model implemented in 311 human kidney samples using the QTLtools (v1.3.1) package71. Quantile normalization was performed on TPM values, and then expression measurements for each gene were rank-based inverse normal transformed3. In order to eliminate the effects of unobserved confounding variables, PEER72 was performed for 30 factors on gene expression with age, gender, collected site, eGFR, top five genotype PCs, sequencing batch and RNA integrity number as covariates (Supplementary Fig. 1c). The Pearson correlation P between known clinical variables and 30 PEER factors are shown in Supplementary Fig. 1d. To correct for multiple testing across all genes, we used the q-value R package73 on the adjusted gene-level P values obtained from 1,000 permutations and significance was assessed at 5% FDR (qvalue<0.05) to identify genes with at least one significant cis eQTL (“eQTL genes”). Moreover, all gene-SNV pair relationships determined in nominal mode were considered significant at a gene-level FDR<0.05.
Variant annotations
Variants were annotated using the Ensembl VEP (v111) at Ensembl homepage (available at https://www.ensembl.org/index.html)16. The variants were subsequently classified into both their functional consequences/types (such as missense, synonymous, UTR, intronic) and the VEP-specific classification of their impact (high, moderate, low, modifier). When a SNV had multiple annotations, the annotation with the highest impact predicted by VEP was retained.
Conditional analysis
We performed approximate conditional analyses to identify independent signals within kidney pQTLs from the European population, estimating LD information from our study sample. To detect independently associated variants from summary statistics, we used GCTA (v1.94.1)75 (COJO79, ‘cojo-slct’) with a stepwise selection approximation. A 250kb window was applied in the cojo-slct step to limit the search space around each signal. Lead SNVs identified from stepwise selection were designated as index SNVs, followed by conditional analysis (cojo-cond) on the remaining variants to detect additional independent signals. All variants with a protein-level FDR<0.05 were included as input, applying the default collinearity cutoff of 0.9. Loci were defined as the ±250kb region around each lead SNV identified in the stepwise selection. To further refine candidate variants, approximate Bayes factors were used to compute posterior inclusion probabilities (PIP) for each SNV within the region, designating the variant with the highest PIP as the sentinel variant. Overlapping regions were merged, designating the variant with the highest PIP as the sentinel for the merged region. Finally, variants identified in the cojo-cond analysis with conditional p-values<1×10⁻⁵ were considered additional independent signals, and only variants with PIP>0.5 were deemed primary variants within each locus.
Power and variance explained estimation for pQTLs
To assess the statistical power of our cohort to detect significant pQTLs and estimate the variance explained by each causal variant, we calculated power and variance explained (R2) for each lead variant. Power estimation was based on sample size (n = 321), effect size (β), and MAF for each variant, using a non-centrality parameter (NCP) approach80. The average power was 0.54, with 225 variants showing power greater than 0.8 (Supplementary Table 3), indicating substantial detection power for these significant variants in our cohort of 321 samples. Variance explained (R2) was calculated using β and MAF values, with an average of 0.023. Notably, 479 variants exceeded an R2 of 0.01, highlighting their meaningful contributions to protein expression variance (Supplementary Table 3). Variants with MAF ≥ 0.24 (median, interquartile range [IQR]: 0.10–0.45) and absolute effect sizes (β) ≥ 0.63 (median, IQR: 0.45–0.83) were reliably detected with statistical power > 0.8.
Classification of pQTL protein localization
Protein localization was categorized based on data from the Protein Atlas Protein Classes database (version 19; available at https://www.proteinatlas.org/humanproteome/subcellular/data#locations). Proteins were categorized into three primary localization groups: Secreted, Membrane, or Intracellular. If a protein was annotated in multiple categories, the Membrane classification was prioritized.
Pathway analysis
All pQTL proteins were imported into The Database for Annotation, Visualization and Integrated Discovery (DAVID, version v2022q2) bioinformatics resource (https://david.ncifcrf.gov/)81. KEGG pathway analysis was performed within DAVID to identify relevant biological pathways and molecular interactions associated with the pQTL proteins. A total of 52 KEGG pathways were evaluated, and pathways with FDR<0.05 were considered significant. DAVID’s default settings were used for pathway enrichment analysis.
We performed pathway enrichment analysis using the Hallmark gene sets (h.all.v2024.1.Hs.symbols.gmt) from the Molecular Signatures Database (MSigDB). All significant pQTL-associated proteins were analyzed against 50 predefined Hallmark pathways using the clusterProfiler package in R (v4.0.5). The analysis followed the Gene Set Enrichment Analysis (GSEA) framework (GSEA v4.3.0, Broad Institute)82. Fisher’s exact test was used to assess enrichment, and FDR was calculated for multiple testing correction. Pathways with FDR<0.05 were considered significant.
GWAS summary statistics for eGFR, blood pressure, and lipid
Meta-analysis of 2.2 million individuals GWAS summary statistics data for eGFR (eGFR GWAS) was leveraged29. For SBP and DBP, we utilized publicly available summary statistics data from previously published GWAS83. Similarly, for LDL-C, HDL-C, TC, and TG, we utilized summary statistics data from publicly available GWAS54.
Bayesian colocalization analysis
We conducted Bayesian colocalization analysis to identify the variants where the genotype effect on kidney function, protein expression and gene expression were shared. In brief, variants in the MHC region on chromosome 6 were excluded first. Given that the eGFR GWAS data were based on the hg19 reference genome, we lifted over our pQTL and eQTL results from hg38 to hg19 using the ucsc-liftover command-line tool with the hg38ToHg19.over.chain file. The most significant eGFR GWAS variants at each locus identified above were defined as leading variants. To estimate the posterior probability that a leading variant is associated with two traits (GWAS and pQTL, GWAS and eQTL), we extracted available variants within 100kb search window for each leading variant. Bayesian colocalization analysis was implemented using R package coloc (v5.1.0)28 with default parameters (p1=1×10⁻⁴, p2=1×10⁻⁴ and p12 =1×10⁻⁵) and input of summary statistics for eGFR GWAS (P value, MAF, sample size), pQTL (effect size and squared standard error) and eQTL (effect size and squared standard error). Then, summary data from both studies of SNVs within 100 kb of each leading SNV were used to calculate the posterior probability. In the coloc results, H4 represents the posterior probability that both traits have associated and shared causal variants. Colocalization analysis using coloc.abf was conducted under the assumption of a single causal variant per locus, using only lead variants, which are the most significant variants at each locus, at the protein or gene level, as previously described with slight modification3. To account for the possibility of multiple causal variants per locus, colocalization analysis was additionally performed using coloc.susie, which allows for multiple independent signals to be assessed within a locus84. Among these, the posterior probability of the variant with the strongest signal was treated as representative for that pQTL and eQTL. We considered a protein or gene to have colocalization evidence if either coloc.abf or coloc.susie yielded H4>0.885, defining proteins and genes meeting this threshold as “coloc protein” and “coloc gene”, respectively.
Additionally, we conducted colocalization analyses between eGFR and SBP and DBP, kidney pQTL and eGFR vs. SBP and eGFR vs. DBP analyses.
To further refine the variants associated with all three traits (GWAS and pQTL and eQTL), we performed Bayesian multiple-trait-colocalization (moloc) analysis using R package moloc (v0.1.0)30 with default parameters prior_var = c(0.01, 0.1, 0.5) and priors = c(1×10^−4, 1×10^−6, 1×10^−7). In moloc results, PPA.abc represents the posterior probability that three traits are associated with each other and share the same variant. PPA.abc>0.8 was considered evidence of colocalization among all three traits.
Summary Mendelian Randomization: SMR
We performed SMR analysis employing two configurations: eGFR GWAS paired with kidney pQTL, and eGFR GWAS paired with kidney eQTL, utilizing the SMR package (v1.3.1)86,87, as previously described with slight modification3. This analytical approach enabled us to investigate the genetic basis of kidney function by integrating eGFR GWAS data with quantitative trait loci information. To distinguish between pleiotropy and linkage in our genetic instruments, we applied the HEIDI test. We utilized the European population reference from the 1,000 Genomes Project67, because most (87%) kidney samples used in this analysis are of European ancestry. For data preparation, we converted pQTL and eQTL summary statistics into binary format (BESD), following the SMR data management guidelines. To reduce potential confounding, variants located in the MHC region on chromosome 6 were systematically excluded from the analysis. Only lead variants (the most significant variants at each locus) at the protein or gene level were used as instruments. In case multiple significant pQTL signals were identified for a single protein, we meticulously retained only the statistically most significant signal. To address issues around multiple testing, Bonferroni threshold (6.44×10^−5, i.e. 0.05/776) was determined based on the number (776) of tested proteins, and used to identify the genes whose expression levels are associated with eGFR GWAS trait. To distinguish pleiotropy from linkage, we used a P value threshold of 0.05 for the HEIDI test, without correcting for multiple tests3,87. Similarly, Bonferroni threshold (2.38×10^−5, i.e. 0.05/2,098) was determined based on the number (2,098) of tested genes, and used to identify the genes whose expression levels are associated with eGFR GWAS trait.
Generalized Summary Mendelian randomization: GSMR
We conducted bidirectional GSMR using the R package gsmr (v1.1.0)35 to test for potential causal relationships between a risk factor and a trait using summary-level data from GWAS. In this study, we investigated the relationships between eGFR and SBP, eGFR and DBP, as well as between eGFR and LDL-C, eGFR and HDL-C, and eGFR and TG. Bonferroni threshold (5.0×10^−3, i.e. 0.05/10) was determined based on the number (8) of tested relationships. The instrumental variables were selected using PLINK clumping algorithm with parameters “—clump-r2 0.01 –clump-kb 10000”. To account for potential sample overlap, GSMR was implemented with the mtCOJO framework, which adjusts for shared samples between exposure and outcome datasets35. Prior studies have demonstrated that sample overlap in large GWAS consortia does not necessarily introduce weak instrument bias if the F-statistic for the instrumental variables is sufficiently high88. In this study, the F-statistics for SBP (53) and DBP (61) exceed the recommended threshold (F>10), ensuring robust instrument strength. Considering previous analyses showing that GSMR estimates remain stable under conditions of partial or full sample overlap89, this approach was applied to minimize bias in causal inference.
Mendelian randomization and colocalization for CKM traits
To ensure a comprehensive assessment of CKM-related traits, we included publicly available GWAS with large sample sizes, based on their relevance to cardiac, kidney and metabolic phenotypes (median n = 502,629; range = 36,041–2,535,601). The 36 GWAS outcomes used were divided into obesity, metabolic dysfunction-associated steatohepatitis (MASH), diabetes, CKD, and atherosclerotic cardiovascular disease (ASCVD). The GWAS for TG90, LDL-C90, waist-to-hip ratio adjusted for body mass index (whradjbmi)91, body mass index (BMI)90, hip circumference90, waist circumference90, fat-free mass index (ffmi)90 and body fat percentage (bfpct)90 were assigned to the obesity category. The GWAS for alanine transaminase (ALT)90, gamma-glutamyl transferase (GGT)90, aspartate aminotransferase (AST)90, alkaline phosphatase (ALP)90, chronic elevated ALT (chronic ALT)92 and liver fat accumulation93 were assigned to the MASH category. The GWAS for type 2 diabetes (T2D)94, HbA1c90, glucose90, fasting glucose95, fasting insulin95 and 2-hour glucose (2hGlu)95 were assigned to the diabetes category. The GWAS for CKD96, eGFR3, urate90, urea90, systolic blood pressure (SBP)90 and diastolic blood pressure (DBP)90 were assigned to the CKD category. The GWAS for coronary artery disease (CAD)97, heart failure98, stroke99, myocardial infarction100, peripheral artery disease101, ischemic stroke99, cardiac magnetic resonance imaging of left ventricular end-systolic volume index (MRI_lvesvi)102 and left ventricular ejection fraction (MRI_lvef)102, myocardial fibrosis103 and dilated cardiomyopathy (DCM)104 were assigned to the ASCVD category. Regarding pQTL sources, apart from the kidney pQTLs in this study, we used plasma pQTL sources from ARIC10, deCODE11, and Fenland41. Regarding eQTL sources for the exposures, those were taken from eQTL meta-analysis of Susztak lab4 and NEPTUNE cohorts105 (kidney tubular & glomeruli). Mendelian randomization (MR) was calculated with the Wald ratio method, implemented in the TwoSampleMR (v0.5.6) R package106. MR was used to test if the top pQTL and eQTL in kidney or plasma was causally linked to any of the GWAS outcomes described above. Moreover, pairwise genetic colocalization implemented in the HyPrColoc tool107 was also used to assess its posterior probability of colocalization between the pQTLs and eQTLs against the same GWAS outcomes. Putative causal links between QTLs and the 36 CKM GWAS outcomes were assessed. For kidney pQTL, the Wald-ratio MR P-value threshold was set to 6.44×10^−5, and only variants with a FDR less than 0.05 at the protein level were used, consistent with the SMR evaluation in eGFR GWAS. For kidney eQTL and plasma pQTL, the Wald-ratio MR P-value threshold was set to 2.50×10^−6 (correcting for the number of protein coding genes), and only variants with P<5×10^−8 were included in the analysis. Additionally, HyPrColoc was used to assess colocalization, with a posterior probability>0.7 and non-uniform priors (with both QTL and GWAS outcomes P<5×10^−8). To reduce false positives and enhance robustness, we included only signals significant in both colocalization and MR in our downstream analysis. This approach leverages the complementary strengths of these methods while mitigating their individual limitations108,109.
Investigation of PLA2R1 QTL effects across multiple tissues
To investigate whether PLA2R1 exhibits significant QTL effects in organs other than the kidney, we extended our analysis to include eQTL data from multiple tissues. We additionally utilized eQTL sources for the exposures, which were taken from GTEx8 (Artery_Aorta, Artery_Tibial, Muscle_Skeletal, Liver, Heart_Atrial_Appendage, Heart_Left_Ventricle, Thyroid, Pancreas, Adipose_Subcutaneous), eQTL meta-analysis of GTEx+STARNET110 (AOR, Aorta; SUF, subcutaneous fat; SKM, skeletal muscle; LIV, Liver), Molhke lab111 (AdipoExpress), and MetaBrain112 (Brain Cortex). MR using the Wald ratio method, implemented in the TwoSampleMR (v0.5.6) R package, was performed to identify significant signals using the same methods as described in the previous section. The same significance thresholds were applied, ensuring consistency with the prior analyses.
Colocalization analysis at the ANGPTL3 Locus
Colocalization analysis by multiple traits was performed using the HyPrColoc tool107 to investigate the shared genetic background among eGFR, LDL-C, HDL-C, and TC GWAS specifically at the ANGPTL3 locus. We used a HyPrColoc posterior probability threshold of >0.7 to determine significant colocalization. Additionally, we conducted colocalization analysis between kidney pQTL/eQTL and LDL-C.
Druggable target analysis
We identified potential causal proteins through colocalization and Mendelian randomization analyses. Specifically, we integrated findings from kidney pQTL and eGFR GWAS, as well as kidney pQTL and 36 CKM GWAS studies. Proteins showing positive signals in these analyses were considered potential drug targets. To assess the current landscape of drugs that either exist or are in development for these targets, we utilized the Drug-Gene Interaction Database (DGIdb), which is a curated resource that compiles metadata on drug-gene interactions from a variety of sources (https://www.dgidb.org/)38. Additionally, we employed DrugnomeAI (https://astrazeneca-cgr-publications.github.io/DrugnomeAI/)39, a stochastic, semi-supervised machine learning framework designed to predict the druggability of proteins encoded by the human exome.
Single nuclei RNA-seq data analysis
We re-analyzed the original published dataset113, which encompassed 155,647 nuclei across 40 identified clusters, by utilizing Scanpy (v1.9.6). For our analysis, these were consolidated into 10 representative clusters to streamline the heatmap presentation. Gene expression for 70 proteins with significant colocalization in the eGFR GWAS and an additional 52 proteins with significant SMR/HEIDI associations was scored using the “sc.tl.score_genes” function in Scanpy, and visualized as a z-score normalized heatmap.
Spatial RNA-seq data analysis
We re-analyzed spatial RNA-seq data113 derived from human kidney tissue to elucidate gene expression patterns. The original dataset involved Visium FFPE sample preparation and quality control as detailed previously113. Our reanalysis utilized the Samui Browser114, a web-based tool for interactive visualization of gene expression data, facilitating a nuanced exploration of spatial gene expression profiles. Spatial RNA-seq data were processed using Space Ranger (v1.0.0) against the GRCh38 reference genome and Visium Human Transcriptome Probe Set v1.0 GRCh38. Data normalization was performed using SCTransform. Analysis was conducted with Seurat for PCA, dataset integration via Harmony, and UMAP visualization. Spot-specific markers were identified with Seurat’s “FindAllMarkers”, applying a log-fold-change>0.25 and FDR<0.05 threshold.
Statistics and Reproducibility
Sample size was not statistically predetermined; samples were selected from the Susztak Lab biobank to ensure balanced demographics and sufficient data quality across proteomics, transcriptomics, and whole-genome sequencing platforms. Inclusion in downstream analyses was based on tissue availability and data completeness. Outliers were excluded based on predefined quality control criteria, as detailed in the Methods, to ensure data integrity. Human tissues were collected in a blinded manner. Downstream analyses were performed with access to relevant clinical metadata for covariate adjustment. This was an observational study without any treatment or intervention. The investigators were not blinded to group allocation during data processing or outcome analysis.
Extended Data
Extended Data Fig. 1. Overview of kidney pQTL analysis: Significance, effect Size, and functional annotation.

(a) Significance level (y-axis) of cis associations according to distance from the TSS (x-axis) for the cognate gene in the cis-window (≤1Mb from the gene body) in kidney pQTL analysis.
(b) Distance from the TSS (x-axis) versus absolute effect size (y-axis) in kidney pQTL data.
(c) MAF versus absolute effect size in kidney pQTL data.
(d) Proportion of functional and uncertain SNVs in pQTLs: This pie chart illustrates the breakdown of SNPs identified as lead SNVs for pQTLs, with a majority categorized as having uncertain functional impact and the remainder with annotated functions based on Ensembl VEP analysis.
(e) SNV functional annotation categories in pQTLs: Distribution of lead pQTL SNVs across functional categories such as coding variants, regulatory/UTR regions, non-codings (including “non coding transcript exon variant,” “non coding transcript variant,” and “NMD transcript variant”), and intronic/intergenic regions.
(f) Effect size distribution by functional annotation in pQTLs: Violin plots showing the distribution of effect sizes of genetic variants on protein levels, segregated by functional annotation. Coding variants demonstrate a significantly higher effect size compared to all other categories. Each dot represents a protein–SNV pair (n=873). Box plots within violins show the median, 25th and 75th percentiles, and values within 1.5× the interquartile range. Group differences were assessed using one-way ANOVA, followed by Tukey’s HSD test.
Extended Data Fig. 2. Comparison of Kidney Tissue pQTLs between Multi-Ancestry and European Populations.
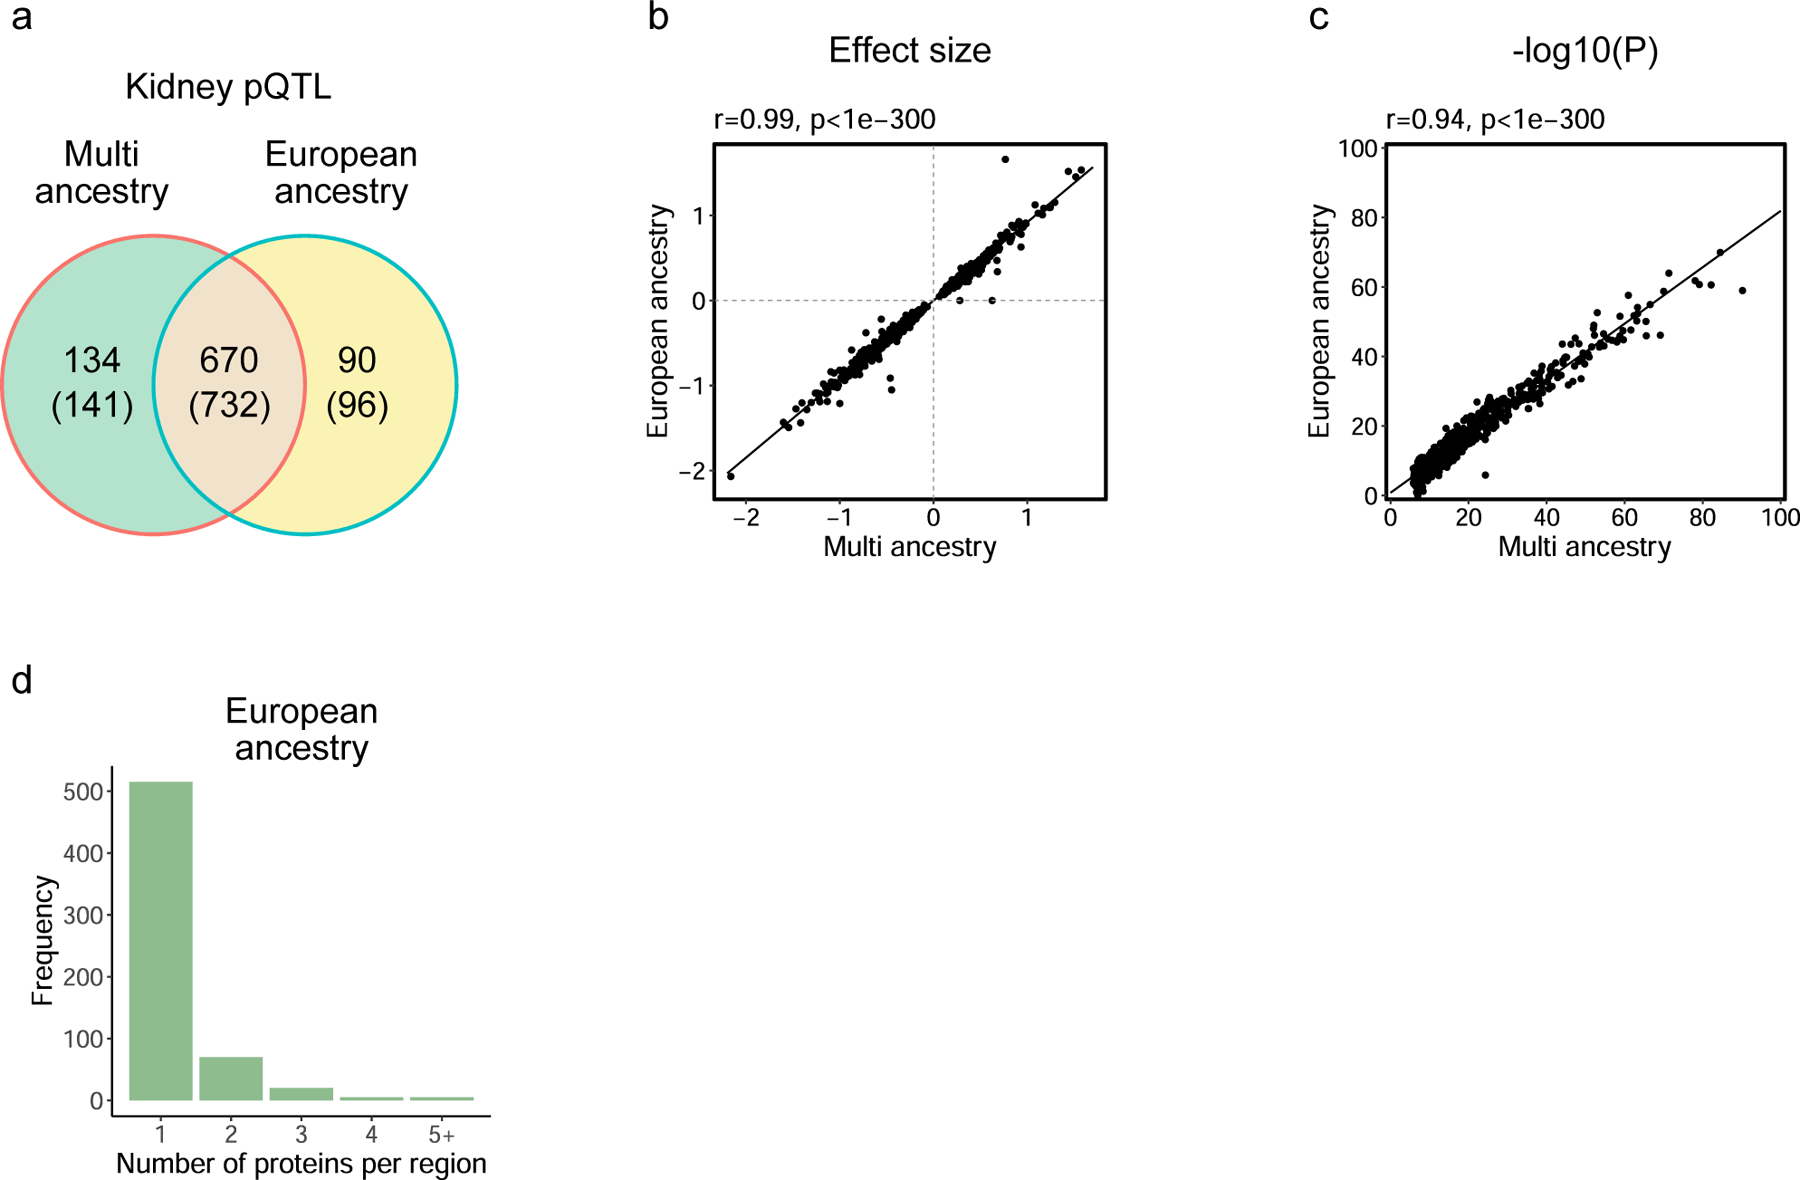
(a) Venn diagram illustrating the unique and overlapping pQTL proteins identified in kidney tissue pQTL analyses conducted in multi-ancestry and European-only populations. Parentheses indicate the unique SOMAmer counts.
(b) Scatter plot showing the correlation of effect sizes for pQTLs between multi-ancestry and European-only analyses. The correlation coefficient was calculated using Spearman’s rho (r), with a two-sided p-value determined by asymptotic t approximation.
(c) Scatter plot comparing the −log10(p-values) for pQTLs between multi-ancestry and European-only analyses. The correlation coefficient was calculated using Spearman’s rho (r), with a two-sided p-value determined by asymptotic t approximation.
(d) Bar plot showing the frequency of loci associated with the number of proteins in the European-only analysis, indicating the number of proteins per genomic region.
Extended Data Fig. 3. Examples of Pathway Networks Highlighted by pQTLs.

(a) Diagrammatic representation of kidney drug metabolism pathways with pQTL insights: This diagram provides a stylized representation of two critical pathways involved in drug metabolism within the kidney: the glutathione (GSH) pathway and the nucleotide metabolism pathway. It outlines the key steps in the GSH pathway in the left, including synthesis, utilization in the redox cycle, conjugation for detoxification, and the recycling of GSH. Concurrently, it depicts the nucleotide metabolism pathway in the right, focusing on the conversion processes of cytosine and thymine to their respective metabolites and the involvement of ATP in nucleotide synthesis and purine metabolism regulation. KEGG pathway analysis identified significant enrichment for drug metabolism (FDR=1.6×10^−4) and xenobiotic metabolism (FDR=7.4×10^−7), with the latter corresponding to drug metabolism in MsigDB. Red boxes signify enzymes that were found to be significant in kidney pQTL analysis.
(b) Overview of the complement pathways: This figure provides a streamlined representation of the complement system, including the classical, lectin, and alternative pathways. Initiation of these pathways occurs through the interaction of complement proteins with various molecular structures. KEGG pathway analysis showed significant enrichment for complement activation (FDR=2.8×10^−5), further supported by MsigDB analysis (FDR=7.3×10^−3). Proteins associated with cis pQTLs are highlighted in red, accompanied by boxplots illustrating protein expression based on allele type, indicated next to SNV IDs. Each dot represents an individual patient. Box plots show the median, 25th and 75th percentiles, and values within 1.5× the interquartile range (n=321). Statistical significance was assessed using a two-sided t-test (for two groups) or one-way ANOVA (for three groups).
GSSG, Glutathione disulfide; GPX1, GPX7, Glutathione peroxidases 1 and 7; GSR, Glutathione reductase; GSH, Glutathione; GGT5, Gamma-glutamyltransferase 5; GSTA1, GSTM1, GSTM3, GSTM4, GSTM5, GSTT2, GSTT2B, GSTO1, GSTP1, Glutathione S-transferases A1, M1, M3, M4, M5, T2, T2B, O1, P1; CDA, Cytidine deaminase; TYMP, Thymidine phosphorylase; ATP, Adenosine triphosphate; TPMT, Thiopurine S-methyltransferase; NME4, NME7, Non-metastatic cells 4 and 7, related to nucleoside diphosphate kinase activity; MeTG, Methylthioguanine; NDP, Nucleoside diphosphate; C1-INH, C1 inhibitor; CFD, complement factor D; CFH, complement factor H; MASP, mannan-binding lectin-associated serine protease; MBL, mannose-binding lectin.
Extended Data Fig. 4. Integration of Kidney Function GWAS (European ancestry population only) and kidney eQTL and pQTL data using Coloc and Moloc Analysis.

(a) Coloc and moloc analysis overlap for eGFR GWAS, and kidney eQTL, and pQTL: Venn diagram illustrating the intersection between proteins and genes identified as significant in coloc analysis and further refined by moloc analysis. This highlights 8 kidney proteins/genes that were found to be significant in moloc.
(b) LocusZoom plots describing the association signals for the ARL6IP5 across eGFR GWAS traits, kidney pQTLs, and eQTLs, with a high posterior probability of association (PPA = 0.99). The lead SNV, rs7039, is also shown. ARL6IP5 serves as a representative example among the 14 proteins/genes found significant in moloc analysis.
(c) ARL6IP5 expression with protein and gene level associations: Box plots illustrating the association of lead SNV of ARL6IP5 (rs7039) (x-axis) with ARL6IP5 protein and RNA expression levels (y-axis).
Linkage disequilibrium (LD) information is derived from the European population data provided by the 1000 Genomes Project. Each dot represents an individual patient (n=321 for protein, n=311 for gene). Box plots show the median, 25th and 75th percentiles, and values within 1.5× the interquartile range. Group differences were assessed using one-way ANOVA.
Extended Data Fig. 5. Comprehensive Analysis of Genetic Influence on Kidney pQTL/eQTL and eGFR GWAS.

(a) Illustration of the use of SMR and HEIDI tests to determine if the same genetic variants influence both kidney pQTL/eQTL and eGFR GWAS, suggesting potential causality.
(b, c) Pie charts displaying the number of pQTL proteins and eQTL genes prioritized for their effects on eGFR were supported by SMR and HEIDI analysis, as well as those supported by SMR analysis alone, where HEIDI did not indicate a significant result.
(d) Manhattan plot representing chromosomal locations (x-axis) and the strength of the SMR significance for eGFR GWAS, and human kidney pQTL expressed as −log10(SMR Pval) (y-axis). The top 25 most significant protein associations are labeled. The red dashed line represents the significance threshold (P=6.44×10^−5, Methods). Blue dots denote significant associations in both SMR and HEIDI analyses, while grey dots indicate non-significant associations.
(e, f) Venn diagrams illustrating (e) proteins and (f) genes showing significance in colocalization (coloc) and prioritized for their potential effects based on SMR and HEIDI analyses for eGFR GWAS.
(g) Combined Venn diagram indicating the overlap between proteins and genes with significant coloc findings and those prioritized based on evidence from both SMR and HEIDI analyses.
(h) The UpSet plot shows the overlap of significant proteins across coloc, SMR/HEIDI, and moloc analyses. Bars represent the number of overlapping proteins for each combination of analyses. SMR & HEIDI refers to proteins that are significant in both SMR and HEIDI analyses.
Extended Data Fig. 6. Comparative Analysis of pQTL and eQTL Signatures in Human Kidney.
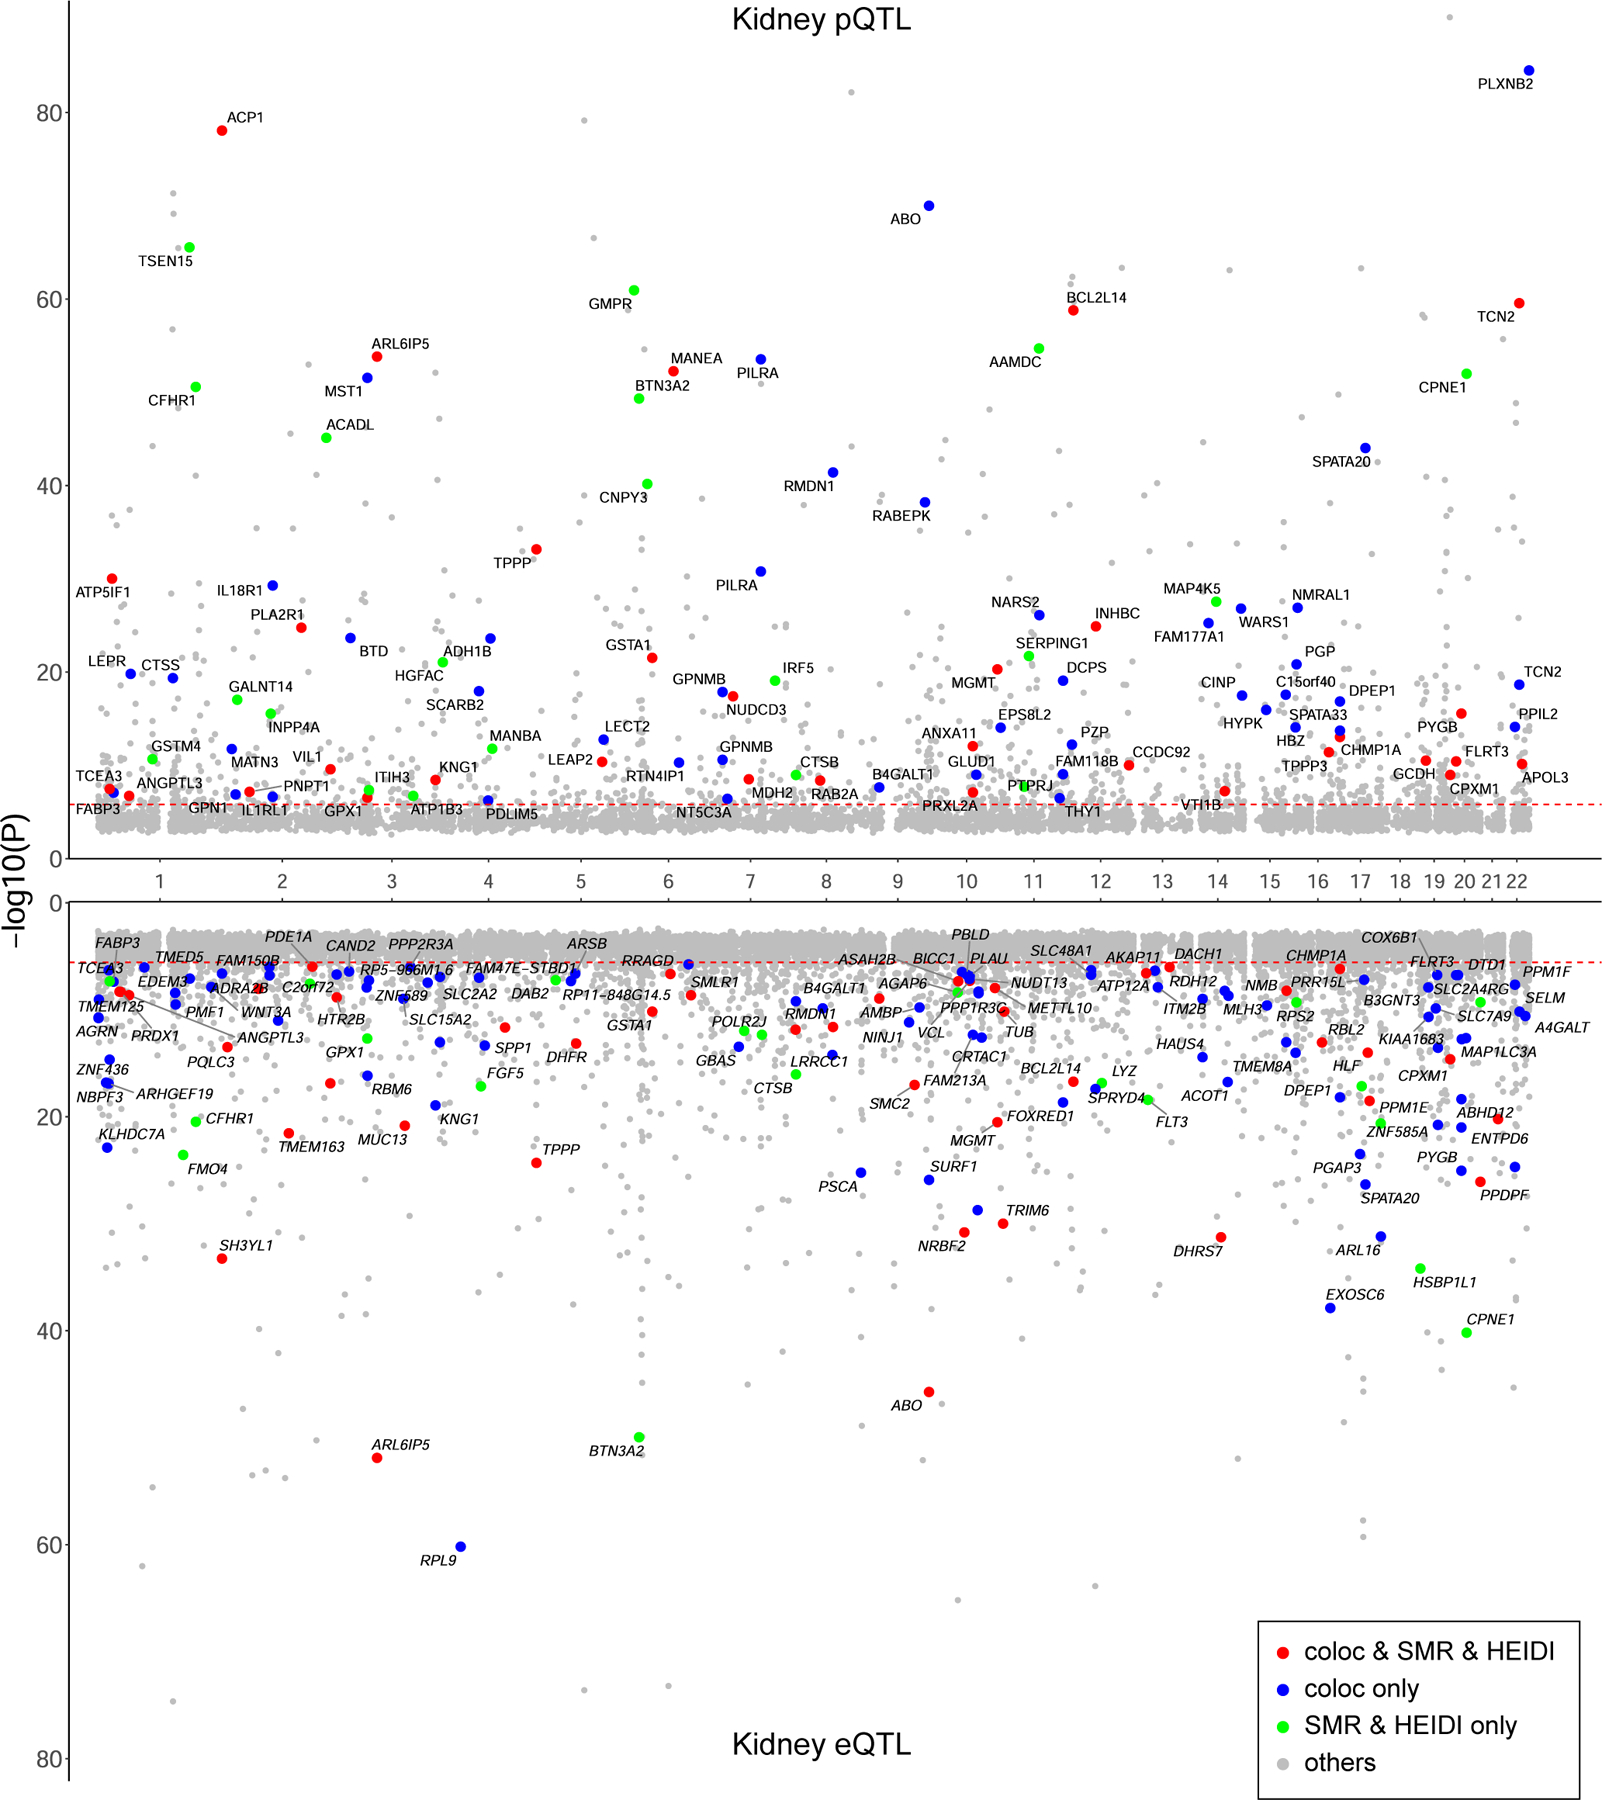
Miami plot illustrating the comparative landscape of pQTL and eQTL in human kidney tissues. The x-axis represents the chromosomal location of SNVs, while the y-axis indicates the strength of the pQTL and eQTL associations, expressed as −log10(Pvalue). Only protein-coding genes are displayed for eQTLs. The plot is color-coded to distinguish the significance and type of association: red points indicate proteins/genes that are significant in both coloc and SMR/HEIDI analyses, blue points signify proteins/genes significant only in coloc analysis, green points represent proteins/genes significant only in SMR/HEIDI analysis. P values for pQTL and eQTL analyses were obtained using QTLtools (linear regression).
Extended Data Fig. 7. Gene Expression Patterns Related to eGFR Risk Kidney Proteins.

(a) Human kidney single cell analysis experiment using 155,647 nuclei extracted from 18 samples.
(b, c) This heatmap details gene expression patterns related to (b) 70 colocalized proteins and (c) 52 proteins that were significant in both SMR and HEIDI tests for eGFR, within kidney nucleus clusters, with distinct groups such as Podo, CNT, and PC maintained. Clusters were merged for Endo (Endo_GC, Endo_Lymphatic, Endo_Peritubular), PT (PT_S1, PT_S2, PT_S3), LOH (segments of the Loop of Henle), DCT (DCT1, DCT2), IC_A (IC_A, IC_B), Stromal (various fibroblasts and stromal cells), and Immune (B cell types, T cell types, NK cells, macrophages and monocytes). Clusters with fewer than 30 nuclei were excluded. Z-scores reflect mean expression levels for each cell type. GPX1 and WARS1 are not represented due to the absence of expression data in this dataset.
Extended Data Fig. 8. Integrated Spatial Transcriptomic Analysis of Human Kidney Sections.

(a) Workflow of integrated spatial analysis, performed on a total of 7 human kidney samples.
(b) Hematoxylin and eosin (HE) staining: A representative image of HE-stained human kidney tissue prepared for single-cell spatial RNA-seq. Scale bar, 500 μm.
(c, d) Spatial expression in glomeruli: Representative images showing spatial transcriptomics for (c) PLA2R1 (green) and NPHS1 (red), (d) TPPP3 (green) and NPHS1 (red), alongside merged images highlighting co-localization in glomeruli. Scale bars, 250 μm.
(e, f) Spatial expression in proximal tubules: Representative images of spatial transcriptomics for (e) DPEP1 (green) and CUBN (red), (f) CHMP1A (green) and CUBN (red), with merged images showing co-expression in proximal tubule cells. Scale bars, 250 μm.
Data shown are representative of spatial transcriptomics from n=7 human kidney samples.
Extended Data Fig. 9. Comprehensive Analysis of Causal Relationships between eGFR, SBP, DBP, LDL-C and HDL-C.

(a) Causality evaluation using GSMR between eGFR and SBP/DBP GWAS. This panel illustrates the evaluation of causality between eGFR and SBP/DBP GWAS using the GSMR method.
(b) This panel shows the bidirectional causal relationships between eGFR and SBP/DBP with their respective beta coefficients and p-values.
(c) Causality evaluation using GSMR between eGFR and LDL-C/HDL-C/TG GWAS: This panel illustrates the evaluation of causality between eGFR and LDL-C/HDL-C/TG GWAS using the GSMR method.
(d) This panel shows the bidirectional causal relationships between eGFR and LDL-C/HDL-C/TG with their respective beta coefficients and p-values.
The intensity of the blue color represents the magnitude of the negative beta values. The thickness of the arrows is proportional to −log10(p-value), which reflects the statistical significance.
GSMR, generalized summary-data-based Mendelian randomization.
Extended Data Fig. 10. Integrative Genetic Analysis of ANGPTL3: Mendelian Randomization and Colocalization Across Cardio-Kidney-Metabolic Traits.

(a) Colocalization analysis of ANGPTL3 across various cardio-kidney-metabolic GWAS traits. The x-axis represents the colocalization posterior probability, while the y-axis lists the examined traits. Kidney eQTLs, kidney pQTLs, and plasma pQTLs from various studies are represented by different shapes and colors, as indicated in the legend. Dots are colored according to their posterior probability, with grey dots representing loci where posterior probability<0.5.
(b) Mendelian Randomization effect sizes and significance for ANGPTL3 across various cardio-kidney-metabolic GWAS traits. The x-axis shows the MR effect size, computed using the Wald ratio method, while the y-axis lists the examined traits. The figure includes eQTLs, kidney pQTLs, and plasma pQTLs from various studies, represented by different shapes and colors as indicated in the legend. The size of the dots corresponds to the −log10(P-value) of the MR effect size. MR P<2.5×10^−6 was considered statistically significant. Associations not reaching this threshold are represented in grey.
ASCVD, atherosclerotic cardiovascular disease; MASH, metabolic dysfunction-associated steatohepatitis; MRI_lvesvi, cardiac magnetic resonance imaging of left ventricular end-systolic volume index; MRI_lvef, cardiac magnetic resonance imaging of left ventricular ejection fraction; DCM, dilated cardiomyopathy; CAD, coronary artery disease; SBP, systolic blood pressure; DBP, diastolic blood pressure; T2D, type 2 diabetes; 2hGlu, 2-hour glucose; GGT, gamma-glutamyl transferase; AST, aspartate aminotransferase; ALT, alanine transaminase; ALP, alkaline phosphatase; whradjbmi, waist-to-hip ratio adjusted for body mass index; TG, triglycerides; ffmi, fat-free mass index; BMI, body mass index; bfpct, body fat percentage; AOR, Aorta; SUF, subcutaneous fat; SKM, skeletal muscle; LIV, Liver.
Supplementary Material
Acknowledgement
The authors’ work described in this article was supported by the National Institutes of Health (NIH grant nos. R01 DK105821, R01 DK087635 and R01 DK076077 to K.S. and R01 DK123459 to M.A.N.). This work was also supported by research grant from Manpei Suzuki Diabetes Foundation to D.H.. The authors acknowledge the use of Biorender.com in creating schematic Fig. 1a, 4e, Extended Data Fig. 7a, 8a, Supplementary Figs. 4 and 9.
Footnotes
Competing interests
The laboratory of Dr. Katalin Susztak (including Dr. Daigoro Hirohama, Dr. Eunji Ha, Dr. Hongbo Liu, Dr. Amin Abedini, Dr. Jonathan Levinsohn, Ms. Allison Vassalotti, Dr. Li Zeng, Dr. Chenyu Li, Dr. Samer Mohandes, and Dr. Steven Vitale) is supported by Gilead, Novo Nordisk, Novartis, GSK, BIPI, Regeneron, Genentech and Calico. Dr. Susztak is on the SAB of Pfizer. Dr. Thao Nguyen, Dr. Niclas Olsson, and Dr. Fiona E. McAllister are employees of Calico Life Sciences. Dr. João Fadista, Dr. Dmitry Shungin and Dr. Anil Karihaloo are employees of Novo Nordisk. All other authors declare no competing interests.
Data availability
Summary statistics for kidney tissue pQTL and eQTL analyses are publicly available at www.susztaklab.com (https://susztaklab.com/pl/pQTL). Individual-level clinical metadata, genomics, transcriptomic, and proteomics data generated in this study cannot be made publicly available, as participant consent for data sharing was not obtained. Researchers who wish to inspect the raw data may apply for controlled access, subject to approval by our institutional data access committee. Requests should be directed to the corresponding author. Raw data, processed data, and metadata from the single nuclear RNA-seq and spatial RNA-seq have been deposited in Gene Expression Omnibus (GEO) with the accession code of GSE211785. The single nuclear expression and spatial data is also available at www.susztaklab.com (https://susztaklab.com/hk_genemap/). No consent was obtained to share individual-level genotype data. Drug–gene interactions were identified using the June 2024 release of the Drug Gene Interaction Database (DGIdb v.4.2.0; interactions.tsv, genes.tsv, and drugs.tsv; https://www.dgidb.org/downloads)38. Public reference resources used include the GRCh38 reference genome (https://www.ncbi.nlm.nih.gov/assembly/GCF_000001405.38), Protein Atlas (https://www.proteinatlas.org/about/download), GTEx (https://gtexportal.org/home/), PDC proteomics dataset (PDC000464; https://pdc.cancer.gov/pdc/study/PDC000464), and Hallmark gene sets from MSigDB (https://www.gsea-msigdb.org). Source data are provided with this paper.
Code availability
All codes used for the analysis are provided via a “GitHub repository [https://github.com/daigorohirohama/Human_Kidney_pQTL]”.
References
- 1.Ndumele CE et al. Cardiovascular-Kidney-Metabolic Health: A Presidential Advisory From the American Heart Association. Circulation 148, 1606–1635 (2023). [DOI] [PubMed] [Google Scholar]
- 2.Sullivan KM & Susztak K Unravelling the complex genetics of common kidney diseases: from variants to mechanisms. Nat Rev Nephrol 16, 628–640 (2020). [DOI] [PMC free article] [PubMed] [Google Scholar]
- 3.Liu H et al. Epigenomic and transcriptomic analyses define core cell types, genes and targetable mechanisms for kidney disease. Nat Genet 54, 950–962 (2022). [DOI] [PMC free article] [PubMed] [Google Scholar]
- 4.Sheng X et al. Mapping the genetic architecture of human traits to cell types in the kidney identifies mechanisms of disease and potential treatments. Nat Genet 53, 1322–1333 (2021). [DOI] [PMC free article] [PubMed] [Google Scholar]
- 5.Qiu C et al. Renal compartment-specific genetic variation analyses identify new pathways in chronic kidney disease. Nat Med 24, 1721–1731 (2018). [DOI] [PMC free article] [PubMed] [Google Scholar]
- 6.Ko YA et al. Genetic-Variation-Driven Gene-Expression Changes Highlight Genes with Important Functions for Kidney Disease. Am J Hum Genet 100, 940–953 (2017). [DOI] [PMC free article] [PubMed] [Google Scholar]
- 7.Eales JM et al. Uncovering genetic mechanisms of hypertension through multi-omic analysis of the kidney. Nat Genet 53, 630–637 (2021). [DOI] [PubMed] [Google Scholar]
- 8.The GTEx Consortium atlas of genetic regulatory effects across human tissues. Science 369, 1318–1330 (2020). [DOI] [PMC free article] [PubMed] [Google Scholar]
- 9.Sun BB et al. Plasma proteomic associations with genetics and health in the UK Biobank. Nature 622, 329–338 (2023). [DOI] [PMC free article] [PubMed] [Google Scholar]
- 10.Zhang J et al. Plasma proteome analyses in individuals of European and African ancestry identify cis-pQTLs and models for proteome-wide association studies. Nat Genet 54, 593–602 (2022). [DOI] [PMC free article] [PubMed] [Google Scholar]
- 11.Ferkingstad E et al. Large-scale integration of the plasma proteome with genetics and disease. Nat Genet 53, 1712–1721 (2021). [DOI] [PubMed] [Google Scholar]
- 12.Xu X et al. Genetic imputation of kidney transcriptome, proteome and multi-omics illuminates new blood pressure and hypertension targets. Nat Commun 15, 2359 (2024). [DOI] [PMC free article] [PubMed] [Google Scholar]
- 13.Ritchie SC et al. Integrative analysis of the plasma proteome and polygenic risk of cardiometabolic diseases. Nat Metab 3, 1476–1483 (2021). [DOI] [PMC free article] [PubMed] [Google Scholar]
- 14.Inker LA et al. New Creatinine- and Cystatin C-Based Equations to Estimate GFR without Race. N Engl J Med 385, 1737–1749 (2021). [DOI] [PMC free article] [PubMed] [Google Scholar]
- 15.Sun BB et al. Genomic atlas of the human plasma proteome. Nature 558, 73–79 (2018). [DOI] [PMC free article] [PubMed] [Google Scholar]
- 16.McLaren W et al. The Ensembl Variant Effect Predictor. Genome Biol 17, 122 (2016). [DOI] [PMC free article] [PubMed] [Google Scholar]
- 17.Enroth S, Hallmans G, Grankvist K & Gyllensten U Effects of Long-Term Storage Time and Original Sampling Month on Biobank Plasma Protein Concentrations. EBioMedicine 12, 309–314 (2016). [DOI] [PMC free article] [PubMed] [Google Scholar]
- 18.Chesnaye NC, Carrero JJ, Hecking M & Jager KJ Differences in the epidemiology, management and outcomes of kidney disease in men and women. Nat Rev Nephrol 20, 7–20 (2024). [DOI] [PubMed] [Google Scholar]
- 19.Dhindsa RS et al. Rare variant associations with plasma protein levels in the UK Biobank. Nature 622, 339–347 (2023). [DOI] [PMC free article] [PubMed] [Google Scholar]
- 20.Shao X et al. CellTalkDB: a manually curated database of ligand-receptor interactions in humans and mice. Brief Bioinform 22(2021). [DOI] [PubMed] [Google Scholar]
- 21.Eldjarn GH et al. Large-scale plasma proteomics comparisons through genetics and disease associations. Nature 622, 348–358 (2023). [DOI] [PMC free article] [PubMed] [Google Scholar]
- 22.Hirohama D et al. Unbiased Human Kidney Tissue Proteomics Identifies Matrix Metalloproteinase 7 as a Kidney Disease Biomarker. J Am Soc Nephrol 34, 1279–1291 (2023). [DOI] [PMC free article] [PubMed] [Google Scholar]
- 23.Battle A et al. Genomic variation. Impact of regulatory variation from RNA to protein. Science 347, 664–7 (2015). [DOI] [PMC free article] [PubMed] [Google Scholar]
- 24.Assum I et al. Tissue-specific multi-omics analysis of atrial fibrillation. Nat Commun 13, 441 (2022). [DOI] [PMC free article] [PubMed] [Google Scholar]
- 25.He B, Shi J, Wang X, Jiang H & Zhu HJ Genome-wide pQTL analysis of protein expression regulatory networks in the human liver. BMC Biol 18, 97 (2020). [DOI] [PMC free article] [PubMed] [Google Scholar]
- 26.Pietzner M et al. Synergistic insights into human health from aptamer- and antibody-based proteomic profiling. Nat Commun 12, 6822 (2021). [DOI] [PMC free article] [PubMed] [Google Scholar]
- 27.Visscher PM et al. 10 Years of GWAS Discovery: Biology, Function, and Translation. Am J Hum Genet 101, 5–22 (2017). [DOI] [PMC free article] [PubMed] [Google Scholar]
- 28.Giambartolomei C et al. Bayesian test for colocalisation between pairs of genetic association studies using summary statistics. PLoS Genet 10, e1004383 (2014). [DOI] [PMC free article] [PubMed] [Google Scholar]
- 29.Liu H et al. Kidney multiome-based genetic scorecard reveals convergent coding and regulatory variants. Science 387, eadp4753 (2025). [DOI] [PMC free article] [PubMed] [Google Scholar]
- 30.Giambartolomei C et al. A Bayesian framework for multiple trait colocalization from summary association statistics. Bioinformatics 34, 2538–2545 (2018). [DOI] [PMC free article] [PubMed] [Google Scholar]
- 31.Guan Y et al. A single genetic locus controls both expression of DPEP1/CHMP1A and kidney disease development via ferroptosis. Nat Commun 12, 5078 (2021). [DOI] [PMC free article] [PubMed] [Google Scholar]
- 32.Ku E, Lee BJ, Wei J & Weir MR Hypertension in CKD: Core Curriculum 2019. Am J Kidney Dis 74, 120–131 (2019). [DOI] [PubMed] [Google Scholar]
- 33.Klag MJ et al. Blood pressure and end-stage renal disease in men. N Engl J Med 334, 13–8 (1996). [DOI] [PubMed] [Google Scholar]
- 34.Jafar TH et al. Progression of chronic kidney disease: the role of blood pressure control, proteinuria, and angiotensin-converting enzyme inhibition: a patient-level meta-analysis. Ann Intern Med 139, 244–52 (2003). [DOI] [PubMed] [Google Scholar]
- 35.Zhu Z et al. Causal associations between risk factors and common diseases inferred from GWAS summary data. Nat Commun 9, 224 (2018). [DOI] [PMC free article] [PubMed] [Google Scholar]
- 36.Raal FJ et al. Evinacumab for Homozygous Familial Hypercholesterolemia. N Engl J Med 383, 711–720 (2020). [DOI] [PubMed] [Google Scholar]
- 37.Shimizugawa T et al. ANGPTL3 decreases very low density lipoprotein triglyceride clearance by inhibition of lipoprotein lipase. J Biol Chem 277, 33742–8 (2002). [DOI] [PubMed] [Google Scholar]
- 38.Freshour SL et al. Integration of the Drug-Gene Interaction Database (DGIdb 4.0) with open crowdsource efforts. Nucleic Acids Res 49, D1144–d1151 (2021). [DOI] [PMC free article] [PubMed] [Google Scholar]
- 39.Raies A et al. DrugnomeAI is an ensemble machine-learning framework for predicting druggability of candidate drug targets. Commun Biol 5, 1291 (2022). [DOI] [PMC free article] [PubMed] [Google Scholar]
- 40.Xie J et al. The genetic architecture of membranous nephropathy and its potential to improve non-invasive diagnosis. Nat Commun 11, 1600 (2020). [DOI] [PMC free article] [PubMed] [Google Scholar]
- 41.Pietzner M et al. Mapping the proteo-genomic convergence of human diseases. Science 374, eabj1541 (2021). [DOI] [PMC free article] [PubMed] [Google Scholar]
- 42.Hoxha E, Reinhard L & Stahl RAK Membranous nephropathy: new pathogenic mechanisms and their clinical implications. Nat Rev Nephrol 18, 466–478 (2022). [DOI] [PubMed] [Google Scholar]
- 43.Coenen MJ et al. Phospholipase A2 receptor (PLA2R1) sequence variants in idiopathic membranous nephropathy. J Am Soc Nephrol 24, 677–83 (2013). [DOI] [PMC free article] [PubMed] [Google Scholar]
- 44.Hoxha E et al. Enhanced expression of the M-type phospholipase A2 receptor in glomeruli correlates with serum receptor antibodies in primary membranous nephropathy. Kidney Int 82, 797–804 (2012). [DOI] [PubMed] [Google Scholar]
- 45.Sukocheva O et al. Current insights into functions of phospholipase A2 receptor in normal and cancer cells: More questions than answers. Semin Cancer Biol 56, 116–127 (2019). [DOI] [PubMed] [Google Scholar]
- 46.Griveau A et al. Targeting the phospholipase A2 receptor ameliorates premature aging phenotypes. Aging Cell 17, e12835 (2018). [DOI] [PMC free article] [PubMed] [Google Scholar]
- 47.Yang B, Shen F, Zhu Y & Cai H Downregulating ANGPTL3 by miR-144–3p promoted TGF-β1-induced renal interstitial fibrosis via activating PI3K/AKT signaling pathway. Heliyon 10, e24204 (2024). [DOI] [PMC free article] [PubMed] [Google Scholar]
- 48.Ma Y et al. Podocyte protection by Angptl3 knockout via inhibiting ROS/GRP78 pathway in LPS-induced acute kidney injury. Int Immunopharmacol 105, 108549 (2022). [DOI] [PubMed] [Google Scholar]
- 49.Sarwar N et al. Interleukin-6 receptor pathways in coronary heart disease: a collaborative meta-analysis of 82 studies. Lancet 379, 1205–13 (2012). [DOI] [PMC free article] [PubMed] [Google Scholar]
- 50.Swerdlow DI et al. The interleukin-6 receptor as a target for prevention of coronary heart disease: a mendelian randomisation analysis. Lancet 379, 1214–24 (2012). [DOI] [PMC free article] [PubMed] [Google Scholar]
- 51.Du XY et al. The potential mechanism of INHBC and CSF1R in diabetic nephropathy. Eur Rev Med Pharmacol Sci 24, 1970–1978 (2020). [DOI] [PubMed] [Google Scholar]
- 52.Yang H, Lian D, Zhang X, Li H & Xin G Key Genes and Signaling Pathways Contribute to the Pathogensis of Diabetic Nephropathy. Iran J Kidney Dis 13, 87–97 (2019). [PubMed] [Google Scholar]
- 53.Schlosser P et al. Transcriptome- and proteome-wide association studies nominate determinants of kidney function and damage. Genome Biol 24, 150 (2023). [DOI] [PMC free article] [PubMed] [Google Scholar]
- 54.Graham SE et al. The power of genetic diversity in genome-wide association studies of lipids. Nature 600, 675–679 (2021). [DOI] [PMC free article] [PubMed] [Google Scholar]
Methods-only references
- 55.Gold L et al. Aptamer-based multiplexed proteomic technology for biomarker discovery. PLoS One 5, e15004 (2010). [DOI] [PMC free article] [PubMed] [Google Scholar]
- 56.Niewczas MA et al. A signature of circulating inflammatory proteins and development of end-stage renal disease in diabetes. Nat Med 25, 805–813 (2019). [DOI] [PMC free article] [PubMed] [Google Scholar]
- 57.Li GX et al. Comprehensive proteogenomic characterization of rare kidney tumors. Cell Rep Med 5, 101547 (2024). [DOI] [PMC free article] [PubMed] [Google Scholar]
- 58.Assarsson E et al. Homogenous 96-plex PEA immunoassay exhibiting high sensitivity, specificity, and excellent scalability. PLoS One 9, e95192 (2014). [DOI] [PMC free article] [PubMed] [Google Scholar]
- 59.O’Brien JJ et al. A data analysis framework for combining multiple batches increases the power of isobaric proteomics experiments. Nat Methods 21, 290–300 (2024). [DOI] [PubMed] [Google Scholar]
- 60.Li H & Durbin R Fast and accurate short read alignment with Burrows-Wheeler transform. Bioinformatics 25, 1754–60 (2009). [DOI] [PMC free article] [PubMed] [Google Scholar]
- 61.Li H et al. The Sequence Alignment/Map format and SAMtools. Bioinformatics 25, 2078–9 (2009). [DOI] [PMC free article] [PubMed] [Google Scholar]
- 62.Picard Tools. Broad Institute. (GitHub Repository. http://broadinstitute.github.io/picard/; 2018). [Google Scholar]
- 63.McKenna A et al. The Genome Analysis Toolkit: a MapReduce framework for analyzing next-generation DNA sequencing data. Genome Res 20, 1297–303 (2010). [DOI] [PMC free article] [PubMed] [Google Scholar]
- 64.Sherry ST et al. dbSNP: the NCBI database of genetic variation. Nucleic Acids Res 29, 308–11 (2001). [DOI] [PMC free article] [PubMed] [Google Scholar]
- 65.Abecasis GR et al. An integrated map of genetic variation from 1,092 human genomes. Nature 491, 56–65 (2012). [DOI] [PMC free article] [PubMed] [Google Scholar]
- 66.The International HapMap Project. Nature 426, 789–96 (2003). [DOI] [PubMed] [Google Scholar]
- 67.Auton A et al. A global reference for human genetic variation. Nature 526, 68–74 (2015). [DOI] [PMC free article] [PubMed] [Google Scholar]
- 68.Mills RE et al. An initial map of insertion and deletion (INDEL) variation in the human genome. Genome Res 16, 1182–90 (2006). [DOI] [PMC free article] [PubMed] [Google Scholar]
- 69.Price AL et al. Long-range LD can confound genome scans in admixed populations. Am J Hum Genet 83, 132–5; author reply 135–9 (2008). [DOI] [PMC free article] [PubMed] [Google Scholar]
- 70.Purcell S et al. PLINK: a tool set for whole-genome association and population-based linkage analyses. Am J Hum Genet 81, 559–75 (2007). [DOI] [PMC free article] [PubMed] [Google Scholar]
- 71.Delaneau O et al. A complete tool set for molecular QTL discovery and analysis. Nat Commun 8, 15452 (2017). [DOI] [PMC free article] [PubMed] [Google Scholar]
- 72.Stegle O, Parts L, Piipari M, Winn J & Durbin R Using probabilistic estimation of expression residuals (PEER) to obtain increased power and interpretability of gene expression analyses. Nat Protoc 7, 500–7 (2012). [DOI] [PMC free article] [PubMed] [Google Scholar]
- 73.Storey JD & Tibshirani R Statistical significance for genomewide studies. Proc Natl Acad Sci U S A 100, 9440–5 (2003). [DOI] [PMC free article] [PubMed] [Google Scholar]
- 74.Yang J et al. Common SNPs explain a large proportion of the heritability for human height. Nat Genet 42, 565–9 (2010). [DOI] [PMC free article] [PubMed] [Google Scholar]
- 75.Yang J, Lee SH, Goddard ME & Visscher PM GCTA: a tool for genome-wide complex trait analysis. Am J Hum Genet 88, 76–82 (2011). [DOI] [PMC free article] [PubMed] [Google Scholar]
- 76.Wingo AP et al. Sex differences in brain protein expression and disease. Nat Med 29, 2224–2232 (2023). [DOI] [PMC free article] [PubMed] [Google Scholar]
- 77.Lee S, Wu MC & Lin X Optimal tests for rare variant effects in sequencing association studies. Biostatistics 13, 762–75 (2012). [DOI] [PMC free article] [PubMed] [Google Scholar]
- 78.Cingolani P et al. A program for annotating and predicting the effects of single nucleotide polymorphisms, SnpEff: SNPs in the genome of Drosophila melanogaster strain w1118; iso-2; iso-3. Fly (Austin) 6, 80–92 (2012). [DOI] [PMC free article] [PubMed] [Google Scholar]
- 79.Yang J et al. Conditional and joint multiple-SNP analysis of GWAS summary statistics identifies additional variants influencing complex traits. Nat Genet 44, 369–75, s1–3 (2012). [DOI] [PMC free article] [PubMed] [Google Scholar]
- 80.Xu F et al. Genome-wide genotype-serum proteome mapping provides insights into the cross-ancestry differences in cardiometabolic disease susceptibility. Nat Commun 14, 896 (2023). [DOI] [PMC free article] [PubMed] [Google Scholar]
- 81.Sherman BT et al. DAVID: a web server for functional enrichment analysis and functional annotation of gene lists (2021 update). Nucleic Acids Res 50, W216–21 (2022). [DOI] [PMC free article] [PubMed] [Google Scholar]
- 82.Subramanian A et al. Gene set enrichment analysis: a knowledge-based approach for interpreting genome-wide expression profiles. Proc Natl Acad Sci U S A 102, 15545–50 (2005). [DOI] [PMC free article] [PubMed] [Google Scholar]
- 83.Evangelou E et al. Genetic analysis of over 1 million people identifies 535 new loci associated with blood pressure traits. Nat Genet 50, 1412–1425 (2018). [DOI] [PMC free article] [PubMed] [Google Scholar]
- 84.Wallace C A more accurate method for colocalisation analysis allowing for multiple causal variants. PLoS Genet 17, e1009440 (2021). [DOI] [PMC free article] [PubMed] [Google Scholar]
- 85.Wang C et al. Genetic architecture of cerebrospinal fluid and brain metabolite levels and the genetic colocalization of metabolites with human traits. Nat Genet 56, 2685–2695 (2024). [DOI] [PMC free article] [PubMed] [Google Scholar]
- 86.Zhu Z et al. Integration of summary data from GWAS and eQTL studies predicts complex trait gene targets. Nat Genet 48, 481–7 (2016). [DOI] [PubMed] [Google Scholar]
- 87.Wu Y et al. Integrative analysis of omics summary data reveals putative mechanisms underlying complex traits. Nat Commun 9, 918 (2018). [DOI] [PMC free article] [PubMed] [Google Scholar]
- 88.Burgess S, Davies NM & Thompson SG Bias due to participant overlap in two-sample Mendelian randomization. Genet Epidemiol 40, 597–608 (2016). [DOI] [PMC free article] [PubMed] [Google Scholar]
- 89.Xue A et al. Unravelling the complex causal effects of substance use behaviours on common diseases. Commun Med (Lond) 4, 43 (2024). [DOI] [PMC free article] [PubMed] [Google Scholar]
- 90.Karczewski KJ et al. Pan-UK Biobank GWAS improves discovery, analysis of genetic architecture, and resolution into ancestry-enriched effects. 10.1101/2024.03.13.24303864 (2024). [DOI] [Google Scholar]
- 91.Pulit SL et al. Meta-analysis of genome-wide association studies for body fat distribution in 694 649 individuals of European ancestry. Hum Mol Genet 28, 166–174 (2019). [DOI] [PMC free article] [PubMed] [Google Scholar]
- 92.Vujkovic M et al. A multiancestry genome-wide association study of unexplained chronic ALT elevation as a proxy for nonalcoholic fatty liver disease with histological and radiological validation. Nat Genet 54, 761–771 (2022). [DOI] [PMC free article] [PubMed] [Google Scholar]
- 93.Haas ME et al. Machine learning enables new insights into genetic contributions to liver fat accumulation. Cell Genom 1(2021). [DOI] [PMC free article] [PubMed] [Google Scholar]
- 94.Suzuki K et al. Genetic drivers of heterogeneity in type 2 diabetes pathophysiology. Nature 627, 347–357 (2024). [DOI] [PMC free article] [PubMed] [Google Scholar]
- 95.Chen J et al. The trans-ancestral genomic architecture of glycemic traits. Nat Genet 53, 840–860 (2021). [DOI] [PMC free article] [PubMed] [Google Scholar]
- 96.Wuttke M et al. A catalog of genetic loci associated with kidney function from analyses of a million individuals. Nat Genet 51, 957–972 (2019). [DOI] [PMC free article] [PubMed] [Google Scholar]
- 97.Aragam KG et al. Discovery and systematic characterization of risk variants and genes for coronary artery disease in over a million participants. Nat Genet 54, 1803–1815 (2022). [DOI] [PMC free article] [PubMed] [Google Scholar]
- 98.Levin MG et al. Genome-wide association and multi-trait analyses characterize the common genetic architecture of heart failure. Nat Commun 13, 6914 (2022). [DOI] [PMC free article] [PubMed] [Google Scholar]
- 99.Mishra A et al. Stroke genetics informs drug discovery and risk prediction across ancestries. Nature 611, 115–123 (2022). [DOI] [PMC free article] [PubMed] [Google Scholar]
- 100.Hartiala JA et al. Genome-wide analysis identifies novel susceptibility loci for myocardial infarction. Eur Heart J 42, 919–933 (2021). [DOI] [PMC free article] [PubMed] [Google Scholar]
- 101.van Zuydam NR et al. Genome-Wide Association Study of Peripheral Artery Disease. Circ Genom Precis Med 14, e002862 (2021). [DOI] [PMC free article] [PubMed] [Google Scholar]
- 102.Pirruccello JP et al. Analysis of cardiac magnetic resonance imaging in 36,000 individuals yields genetic insights into dilated cardiomyopathy. Nat Commun 11, 2254 (2020). [DOI] [PMC free article] [PubMed] [Google Scholar]
- 103.Nauffal V et al. Genetics of myocardial interstitial fibrosis in the human heart and association with disease. Nat Genet 55, 777–786 (2023). [DOI] [PMC free article] [PubMed] [Google Scholar]
- 104.Sakaue S et al. A cross-population atlas of genetic associations for 220 human phenotypes. Nat Genet 53, 1415–1424 (2021). [DOI] [PMC free article] [PubMed] [Google Scholar]
- 105.Han SK et al. Mapping genomic regulation of kidney disease and traits through high-resolution and interpretable eQTLs. Nat Commun 14, 2229 (2023). [DOI] [PMC free article] [PubMed] [Google Scholar]
- 106.Hemani G, Tilling K & Davey Smith G Orienting the causal relationship between imprecisely measured traits using GWAS summary data. PLoS Genet 13, e1007081 (2017). [DOI] [PMC free article] [PubMed] [Google Scholar]
- 107.Foley CN et al. A fast and efficient colocalization algorithm for identifying shared genetic risk factors across multiple traits. Nat Commun 12, 764 (2021). [DOI] [PMC free article] [PubMed] [Google Scholar]
- 108.Gill D et al. Common pitfalls in drug target Mendelian randomization and how to avoid them. BMC Med 22, 473 (2024). [DOI] [PMC free article] [PubMed] [Google Scholar]
- 109.Zuber V et al. Combining evidence from Mendelian randomization and colocalization: Review and comparison of approaches. Am J Hum Genet 109, 767–782 (2022). [DOI] [PMC free article] [PubMed] [Google Scholar]
- 110.Koplev S et al. A mechanistic framework for cardiometabolic and coronary artery diseases. Nat Cardiovasc Res 1, 85–100 (2022). [DOI] [PMC free article] [PubMed] [Google Scholar]
- 111.Brotman SM et al. Adipose tissue eQTL meta-analysis reveals the contribution of allelic heterogeneity to gene expression regulation and cardiometabolic traits. bioRxiv (2023). [DOI] [PMC free article] [PubMed] [Google Scholar]
- 112.de Klein N et al. Brain expression quantitative trait locus and network analyses reveal downstream effects and putative drivers for brain-related diseases. Nat Genet 55, 377–388 (2023). [DOI] [PMC free article] [PubMed] [Google Scholar]
- 113.Abedini A et al. Single-cell multi-omic and spatial profiling of human kidneys implicates the fibrotic microenvironment in kidney disease progression. Nat Genet 56, 1712–1724 (2024). [DOI] [PMC free article] [PubMed] [Google Scholar]
- 114.Sriworarat C et al. Performant web-based interactive visualization tool for spatially-resolved transcriptomics experiments. Biol Imaging 3, e15 (2023). [DOI] [PMC free article] [PubMed] [Google Scholar]
Associated Data
This section collects any data citations, data availability statements, or supplementary materials included in this article.
Supplementary Materials
Data Availability Statement
Summary statistics for kidney tissue pQTL and eQTL analyses are publicly available at www.susztaklab.com (https://susztaklab.com/pl/pQTL). Individual-level clinical metadata, genomics, transcriptomic, and proteomics data generated in this study cannot be made publicly available, as participant consent for data sharing was not obtained. Researchers who wish to inspect the raw data may apply for controlled access, subject to approval by our institutional data access committee. Requests should be directed to the corresponding author. Raw data, processed data, and metadata from the single nuclear RNA-seq and spatial RNA-seq have been deposited in Gene Expression Omnibus (GEO) with the accession code of GSE211785. The single nuclear expression and spatial data is also available at www.susztaklab.com (https://susztaklab.com/hk_genemap/). No consent was obtained to share individual-level genotype data. Drug–gene interactions were identified using the June 2024 release of the Drug Gene Interaction Database (DGIdb v.4.2.0; interactions.tsv, genes.tsv, and drugs.tsv; https://www.dgidb.org/downloads)38. Public reference resources used include the GRCh38 reference genome (https://www.ncbi.nlm.nih.gov/assembly/GCF_000001405.38), Protein Atlas (https://www.proteinatlas.org/about/download), GTEx (https://gtexportal.org/home/), PDC proteomics dataset (PDC000464; https://pdc.cancer.gov/pdc/study/PDC000464), and Hallmark gene sets from MSigDB (https://www.gsea-msigdb.org). Source data are provided with this paper.
All codes used for the analysis are provided via a “GitHub repository [https://github.com/daigorohirohama/Human_Kidney_pQTL]”.