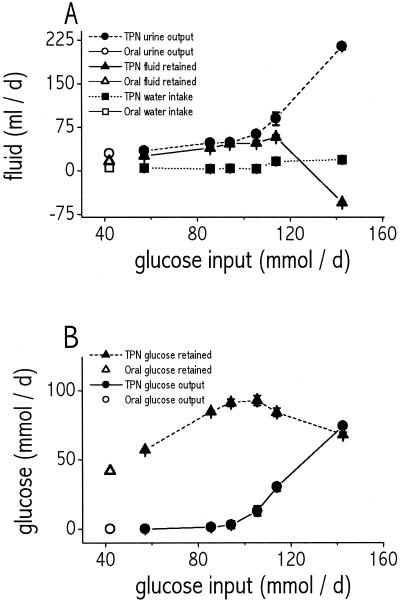
Figure 2.
(A) Effect of glucose input load (mmol/day) on urine output (circles), total fluid retained (triangles), and water intake (squares). Filled symbols, TPN-nourished rats. Open symbols, orally nourished rats. Fluid volume retained was calculated as the sum of TPN infused plus water consumed minus urine output, neglecting evaporative water loss. Note that, at the highest infusion rate of 142.5 mmol/day glucose, urine output increases greatly, leading to paradoxical dehydration (negative fluid retained). Values are averages of the three treatment days for all groups except rats of the 142.5 mmol/day treatment group, which were killed after 18 h of infusion; their values were extrapolated to 24 h. Values for the 114 mmol/day treatment group are from the four rats that survived infusion for 3 days. (B) Effect of glucose input load on glucose retained (triangles) and glucose output (circles). Filled symbols, TPN-nourished rats. Open symbols, orally nourished rats. Glucose retained was calculated as glucose input minus urinary glucose output (fecal glucose output was negligible). Note that rats were able to retain a maximum of 92 mmol/day glucose, which suggests a ceiling on glucose processing capacity. n = 4–18 rats per data point. Bars indicate SEM.

