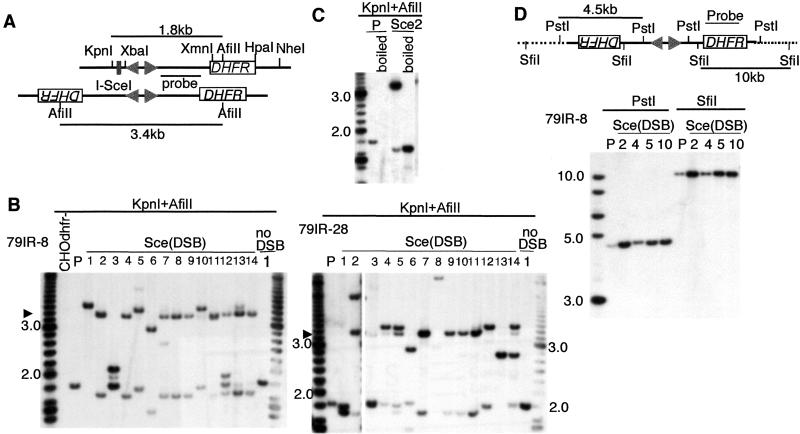
Figure 3.
Palindrome formation after DSB induction in 79IRSce transformants. (A) Restriction maps of the expected structures. In the original construct, the AfiII-KpnI fragment detectable by the probe indicated is 1.8 kb. If palindrome formation occurs after cleavage at the I-SceI site, this KpnI site will be lost, and the fragment will be replaced by a 3.4-kb AfiII fragment. Solid lines represent sequences of the transgene. (B) Southern blotting analysis of DNA from MTX-resistant subclones. Subclones from transformants 79IR-8 and 79IR-28 are shown as examples. After DSB, many subclones produced the 3.4-kb AfiII fragment indicative of the palindrome predicted. In some subclones (e.g., subclones 5 and 10 from 79IR-8), a slightly larger fragment is seen that represents a variant palindrome. In other subclones (e.g., subclones 12 and 13 of 79IR-8 and subclones 2 and 5 of 79IR-28), multiple fragments, including the 3.4-kb fragment, were detected. They could contain a mixture of rearrangements or be a mixture of cells with different rearrangements and were not counted as palindromes in Fig. 2. Size markers (200-bp ladder) are shown on both sides of the gel. P, parental transformant. (C) Snap-back analysis of the palindromic DNA. The 3.4-kb fragment is always accompanied by a l.7-kb fragment of lower intensity, which could be a snap-back form of the palindrome. After heat denaturation and rapid cooling (boiled), the 3.4-kb fragment disappears and the 1.7-kb fragment becomes dominant. (D) Extension of palindromic structure outside of the transgene. DNA from the parental transformant 79IR-8 (P), subclones with a short IR-mediated palindrome (2, 4), and end-to-end joining palindrome (5, 10) were digested with SfiI or PstI and probed with the DHFR gene. In all cases, only one fragment was detected, suggesting that both arms of the palindrome are identical to that of the parental transformant and extend beyond the transgene. Solid lines represent sequences of the transgene, and dotted lines represent the flanking genomic sequence. A 1-kb ladder is used as size marker.

