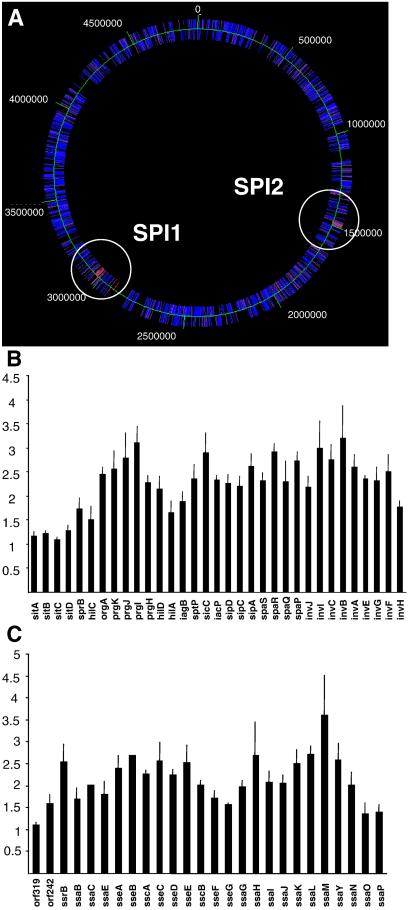
Figure 2.
The pnp mutation of MC2 increases the expression of 87 S. typhimurium genes. (A) Color code presentation displaying relative amounts of mRNA originating from 3,169 separate ORFs positioned on the chromosome. Increasing mRNA levels in MC2 are shown on a scale from blue to red. Two clusters encoding increased mRNA are located in SPI 1 and SPI 2. (B and C) The actual increases for individual genes in MC2 are shown, where 1 represents a 1:1 ratio of MC2 to MC1 transcripts. The error bars indicate the standard error of the mean.

