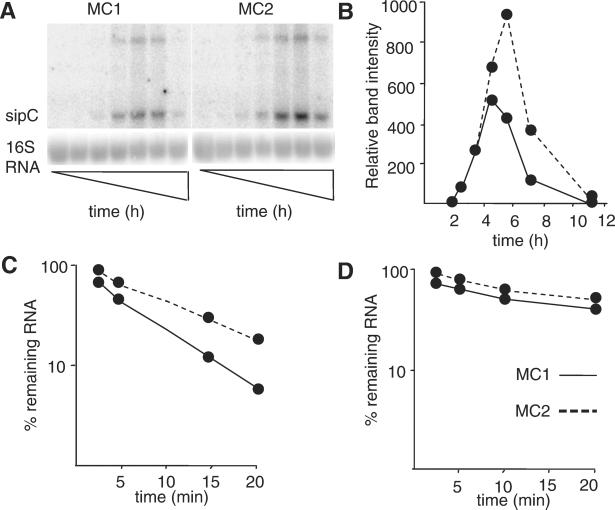
Figure 3.
Effect of PNPase on the stability of the sipC transcript. (A) Expression of the sipC transcript was followed by Northern blot analysis during growth of MC1 and MC2 in LB at 37°C. Samples were taken after 2, 3, 4, 5, 7, and 11 h. (B) A PhosphorImage quantification of the sipC band intensities is shown. Quantification of sipC (C) or ompA (D) mRNA also was performed on samples taken at intervals after the addition of rifampicin (200 μg/ml). Band intensities of the transcripts were quantified and normalized to the amount of 16S rRNA. The signal strength at time 0 was set as 100%. (C and D) The percentage of remaining transcript at the different times after addition of rifampicin is shown.

