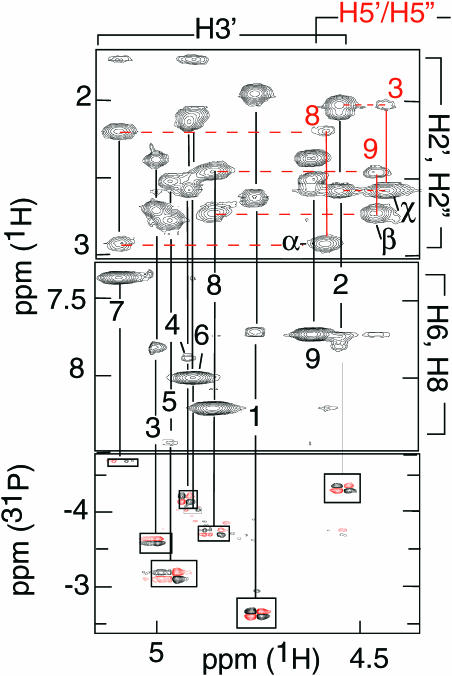
Figure 4.
Selected regions of the NOESY (mixing time 50 ms) and 1H-31P COSY spectra of [d(5mCCTCACTCC)]2. The H3′ and some H5′ protons are labeled by the residue number, black and red, respectively. Top panel: H2′/H2″-H3′ intra-residue cross peaks and sequential (H2′/H2″)n-(H5′)n+1 cross-peaks between: (α) T7(H2″)-C8(H5′); (β) C8(H2″)-C9(H5′); (χ) C2(H2″)-C3(H5′). With the exception of C8(H2″)-C9(H5″) (data not shown) the corresponding H2′/H2″-H5″ cross peaks are absent. Central Panel: The strong intensity of the intra-residue H3′-H6/H8 cross peaks indicates the N-conformation of C6, T7, C8 and C9. Lower panel: The 1H-31P COSY spectrum shows systematic weak H3′-31P COSY cross peaks for the sugar in the N conformational range. Solution condition: T = 5°C, pH 4.4, 2HO solution, strand concentration 6 mM.

