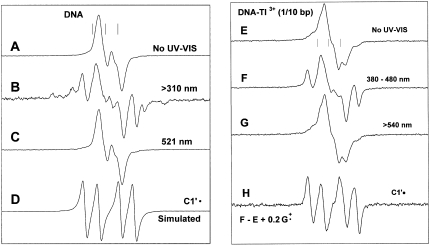
Figure 3.
(A) ESR spectrum of DNA ice samples (50 mg/ml D2O) γ-irradiated to 15.4 kGy dose, annealed to 130 K to eliminate •OH. (B) After illumination at 77 K for 1 h with light >310 nm. (C) After illumination of an identically prepared sample as in (A), at 521 nm for 30 min. (D) Simulated spectrum of C1′• using the parameters shown in Table 1. This spectrum matches line components in spectrum B. (E) ESR spectrum of DNA (50 mg/ml) with 1 Tl3+/10 base pairs γ-irradiated to 15.4 kGy dose, annealed to 130 K to eliminate •OH. (F) After illumination, at 77 K, of the sample in E with 380–480 nm light for 110 min; (G) After illumination, at 77 K, of an identically prepared sample as in E, using light with wavelength >540 nm, for 30 min. (H) Subtraction of E from F, plus addition of 0.2G•+ showing the growth of the spectrum from C1′•; addition of the G•+ spectrum added compensates for its loss in F on photolysis.

