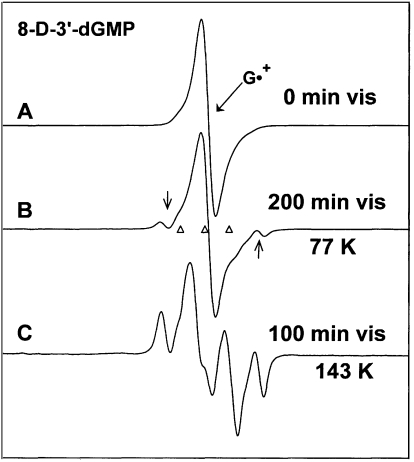
Figure 7.
(A) ESR spectrum of G•+ in 8-D-3′-dGMP. The deuteron at C8 causes this spectrum to be sharper than other G•+ spectra shown. (B) After visible light illumination at 77 K. Two C1′• line components are visible (arrows). (C) After illumination, at 143 K, of a fresh sample of G•+, showing a composite spectrum from (C5′•) (central doublet, 50%), C1′• (quartet, 35%) and G•+ (15%). Subtractions of the C1′• and the G•+ spectra from (7C) result in spectrum 1B, the benchmark for C5′•.

