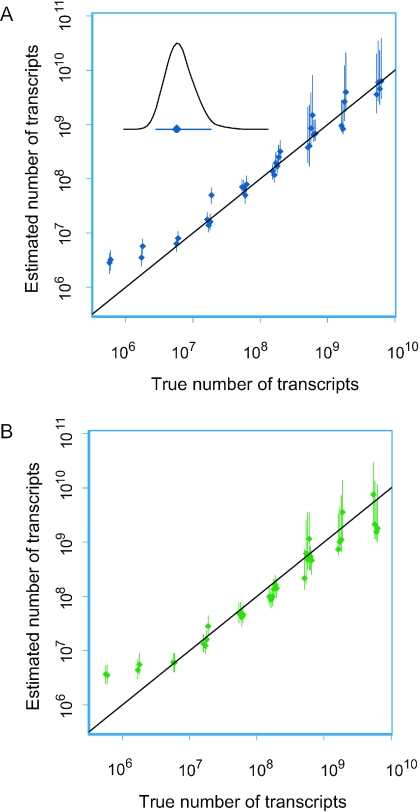
Figure 2.
Validation of the methodology to estimate absolute numbers of transcripts. Control samples with 17 genes of known mRNA concentrations were used, each printed on six spots with six different pens. The data in (A) and (B) are based on two different dye–swap experiments and show estimated numbers of transcripts (y-axis) and true ones (x-axis). Positions on the x-axis are slightly shifted to facilitate visualization. Diagonal lines are shown; the fit is good when the line passes through the credibility interval. The inset in (A) shows the posterior probability density of the number of transcripts for a gene with estimated 5.8 × 10⁷ mRNA molecules (mode) and its 95% credibility interval. The data in (A) were used to determine the hybridization factor, which was found to be 4.31 × 10⁻¹⁰. Analysis of the data in (B), using the hybridization factor from (A) showed a strong concordance between the two estimates, although the numbers of transcripts were slightly underestimated.

