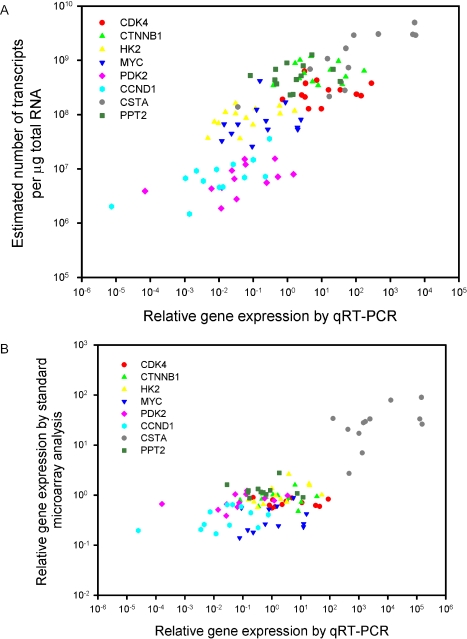
Figure 3.
qRT-PCR validation of the methodology to estimate absolute numbers of transcripts. Transcript concentration (number of transcripts per µg total RNA) of 10 157 genes and ESTs in 12 cervical tumours and a pool of 10 cancer cell lines was determined with our technique. Our estimated concentrations and the standard log-ratio data of eight genes covering the whole concentration range were plotted against the corresponding data achieved with qRT-PCR in (A) and (B), respectively. TBP was used as endogenous control of the qRT-PCR data. The data in (A) show a strong correlation between our estimates and the qRT-PCR data (r = 0.79, P < 0.0001, Pearson product moment correlation for all points). There was also positive correlation, sometimes significant, for some individual genes, despite a limited concentration range (r = 0.81, P = 0.0007 for CSTA; r = 0.71, P = 0.007 for CCND1; r = 0.50, P = 0.09 for HK2; r = 0.48, P = 0.1 for PDK2). The correlation remained if each estimated concentration was first normalized dividing it with the corresponding estimated concentration of TBP in the same sample and then plotted against the qRT–PCR data, since the estimate concentrations of this gene differed little among the tumours (P < 0.0001, data not shown). In (B), the cell line data served as a reference sample. The log-ratios in (B) were calculated relative to the intensities measured for the cell lines. All intensities were first normalized, using standard lowess normalization. There was also a significant correlation between these data and the qRT-PCR data (r = 0.77, p < 0.0001) which seemed mainly to be due to the highly expressed CSTA. Analysis of individual genes showed a significant correlation only for HK2 (r = 0.58, P = 0.05). Many genes with highly different concentration estimates (A) had similar standard log-ratio expressions (B). The concentrations can be compared directly between tumours and genes, whereas the log-ratios can be compared only between tumours for the same gene since their values depend on the transcript level of the reference sample.

