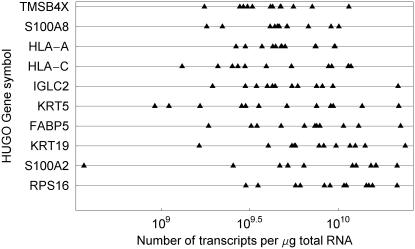
Figure 5.
Transcript concentration (number of transcripts per µg total RNA) for 10 genes in cervix cancer with highest estimated mean concentration. Each point represents the estimated value of a single tumour, showing large differences in transcript concentration among the tumours. The within gene range (max–min) varies from 10 (TMSB4X; C4A) to 100 (S100A2; MAG).

