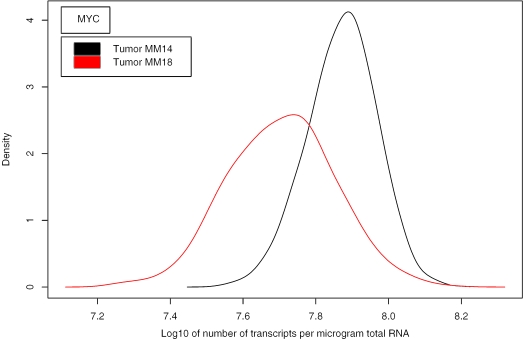
Figure 6.
Posterior probability density of the transcript concentration (number of transcripts per µg total RNA) for the oncogene MYC in two different cervix tumours. The mode of this density is the estimated concentration as listed at http://www.nr.no/pages/samba/area_emr_smbi_transcount. There was a significant difference in the concentration between the tumours (P < 0.001, Kolmogorov–Smirnov test). The qRT-PCR data (relative to TBP) were 0.24 for MM14 and 0.023 for MM18, in agreement with our estimates.

