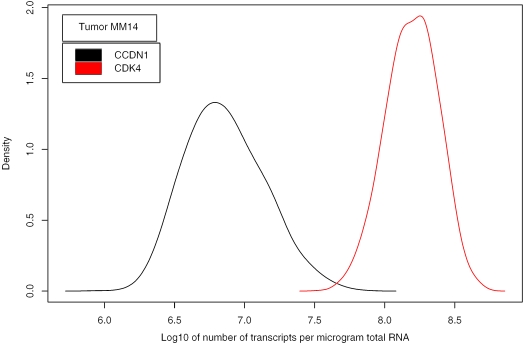
Figure 7.
Posterior probability density of the transcript concentration (number of transcripts per µg total RNA) for the cell cycle control genes CCND1 and CDK4 in a cervix tumour. Both genes are involved in the G1 phase of the cell cycle. The mode of this density is the estimated concentration as listed at http://www.nr.no/pages/samba/area_emr_smbi_transcount. There was a significant difference in the concentration between the genes (P < 0.001, Kolmogorov-Smirnov test). The qRT-PCR data (relative to TBP) were 0.013 for CCND1 and 4.12 for CDK4, in agreement with our estimates.

