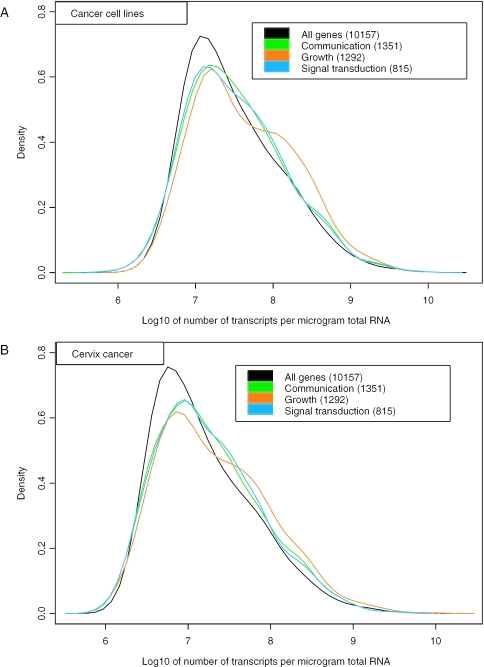
Figure 8.
Posterior probability densities of transcript concentrations (number of transcripts per µg total RNA) of genes known to be involved in communication (green), growth (orange) and signal transduction (blue) for cancer cell lines (A) and cervix cancer (B). The calculations were based on a pool of 10 cancer cell lines and 12 cervix tumours. The number of genes in each functional group is indicated. Some genes were shared by the groups. The distribution of all 10 157 genes and ESTs is also shown (black). All distributions were skewed to the right and had similar median values.

