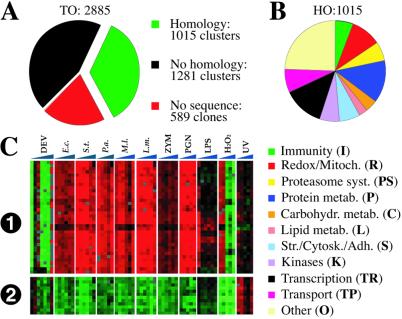
Figure 1.
Microarray methods. (A) Clone and clone cluster composition as described in the text. (B) Allocation of the HO genes to functional classes according to previous work (9) and manual database searches. (C). Reproducibility of un-averaged expression data (i) of a gene of complex splicing pattern and unknown function represented by 17 clones in the microarray and (ii) of a ribosomal protein gene represented by six clones. Two replicate spots (consecutive rows) on the array are shown for each clone. Normally, the 34 and 12 rows, respectively, would be averaged. Vertical sectors and columns represent profiles from seven developmental stages (DEV) and six time-course studies in cells challenged as in Fig. 2 or by UV irradiation. Note that, consistently, gene 1 is underrepresented in all developmental stages except the third (2nd instar larvae) and last (adult); it is overexpressed in all bacterial and PGN experiments but only in the first two time points of H2O2 challenge. Gene 2 is consistently down-regulated in all bacterial, PGN, and H2O2 experiments but is up-regulated by UV challenge.

