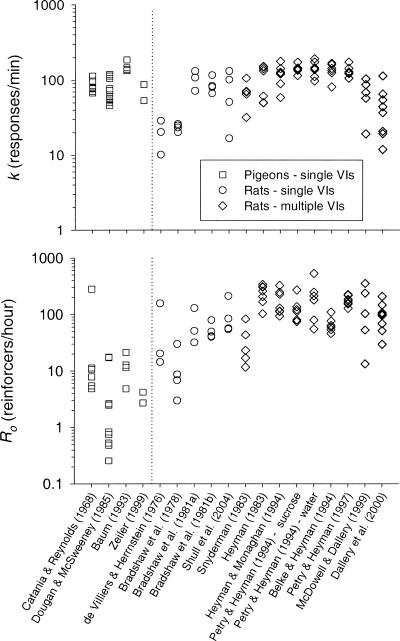
Fig. 4. The values of k (top panel) and Ro (bottom panel) from the fits of Equation 2 to the data from the studies indicated.
Each point represents the value from an individual subject. Points to the left of the vertical line are from pigeons; those to the right are from rats.

