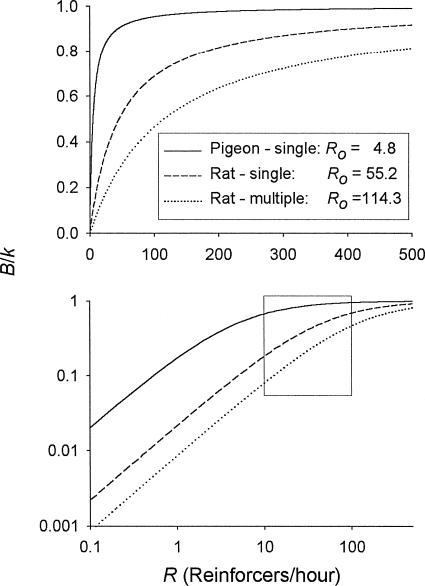
Fig. 6. Response rate as a proportion of the maximum response rate (B/k) plotted as a function of the reinforcer rate (R) for pigeons and for the two groupings of rats.
The plots were generated from Equation 2 after dividing each side of the equation by k—that is, B/k = R/(R + Ro). The k and Ro values for these three plots are the median values for the groupings indicated. The axes in the top panel are linearly scaled; those in the bottom panel are logarithmically scaled. The rectangle in the bottom panel encloses the region over the range of reinforcer rates between 10 per hour and 100 per hour.

