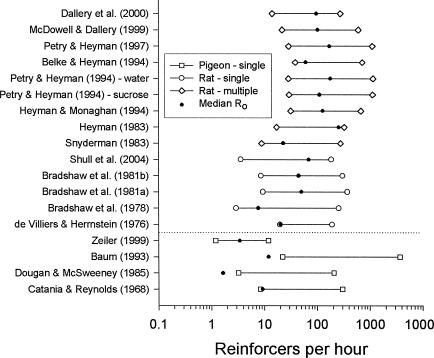
Fig. 7. The range of reinforcer rates for the studies indicated (based on median low and high reinforcer rates from the study).
Studies with pigeons are shown below the horizontal line; those with rats are above the line. The solid dot on each line indicates the median value of Ro for the corresponding data set. All reinforcer rates are obtained values except for those from Catania and Reynolds (1968) and Zeiler (1999), which are scheduled values.

