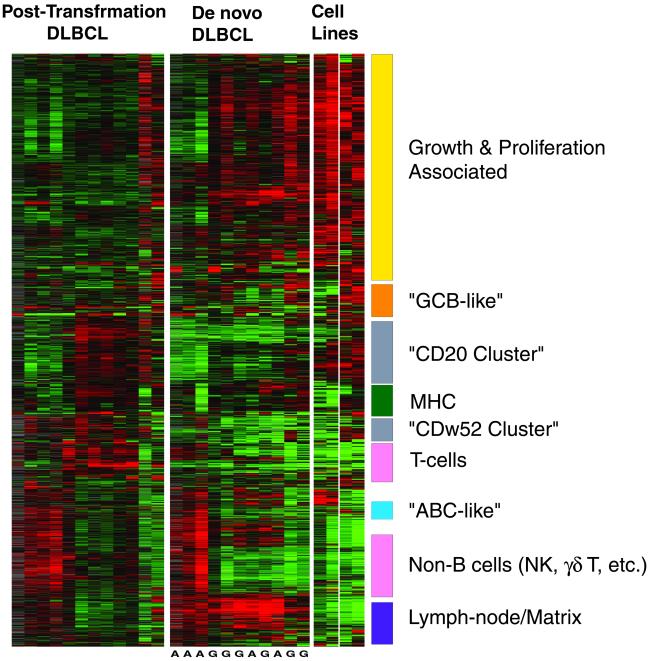
Figure 2.
Gene-expression clusters in post-transformation and de novo DLBCL. Depicted are 2,205 gene-expression measurements made on 27 microarray analyses of 12 post-transformation DLBCL, 11 de novo DLBCL, cell lines, and purified germinal center B (GCB) cells. Each row represents a separate cDNA clone on the microarray and each column a separate mRNA sample. The results presented represent the ratio of hybridization of fluorescent cDNA probes prepared from each experimental mRNA sample to a reference mRNA sample, relative gene expression, depicted according to the color scale shown in Fig. 1. A, ABC type DLBCL; G, GCB type DLBCL [as determined previously for these cases (16)].

