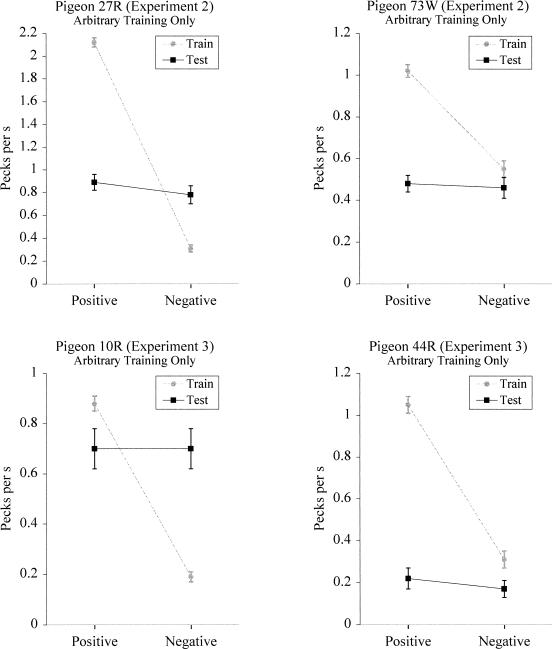
Fig. 3. Individual graphs show the mean response rates in pecks per second for the positive and negative baseline and symmetry combinations during testing for the pigeons that were trained with arbitrary matching trials only.
Data for Pigeon 27R (top left; Experiment 2), Pigeon 73W, (top right; Experiment 2), Pigeon 10R (bottom left; Experiment 3), and Pigeon 44R (bottom right; Experiment 3) are depicted.

