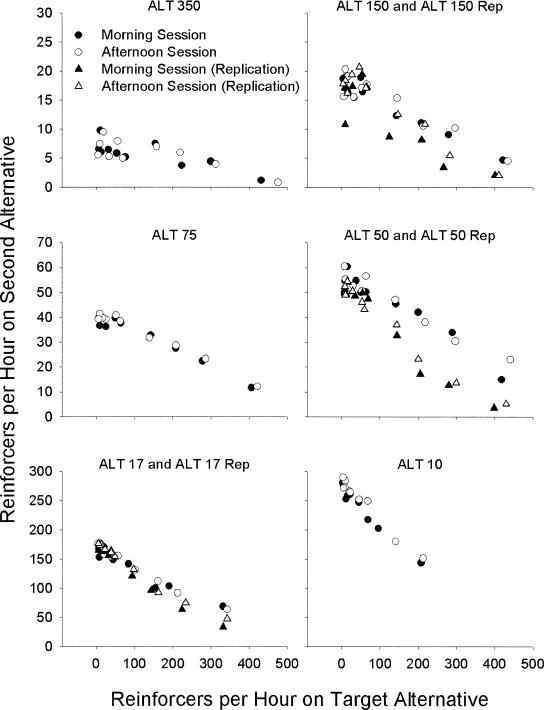
Fig. 2. Reinforcer rate on the second alternative as a function of reinforcer rate on the target alternative for morning and afternoon sessions.
Each panel depicts data from a single condition or a condition and its replication. Each data point represents the average reinforcer rate on the second alternative, across rats, versus the average reinforcer rate on the target alternative, across rats, at each target alternative VI value. Filled symbols represent averages from morning sessions and open symbols represent averages from afternoon sessions.

