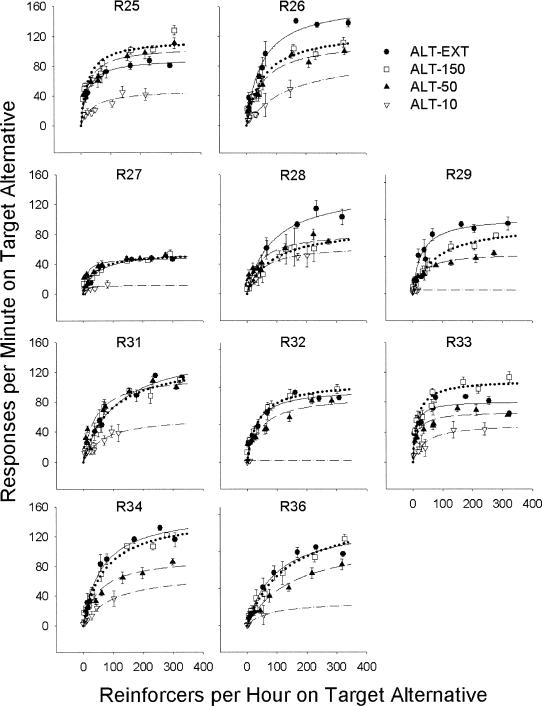
Fig. 4. Target alternative response rate as a function of target alternative reinforcer rate.
Each panel depicts data for an individual rat from the ALT-EXT, ALT-150, ALT-50, and ALT-10 conditions. Error bars represent plus or minus one standard error of the mean. Curved lines in each panel represent fits of Equation 1 to the data from a condition.

