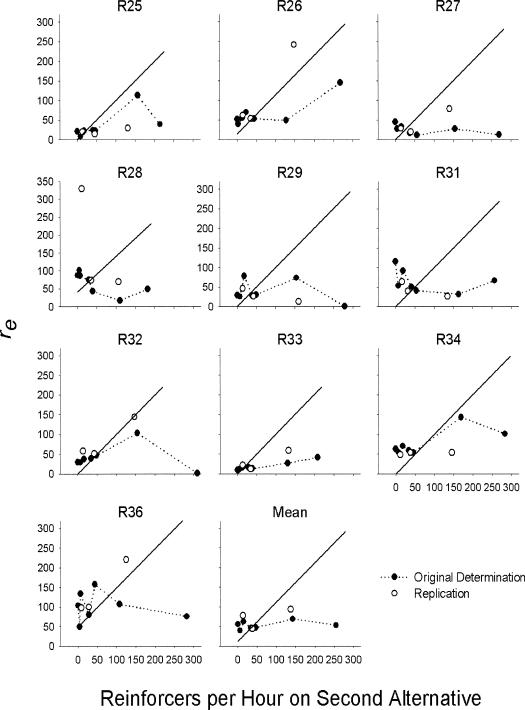
Fig. 5. Estimates of re from fits of Equation 1 as a function of average reinforcer rate on the second alternative.
Each panel depicts data for an individual rat. Solid circles represent estimates obtained from original determinations. Open circles represent estimates obtained from replication conditions. The solid line in each panel represents the best fit of Equation 7.

