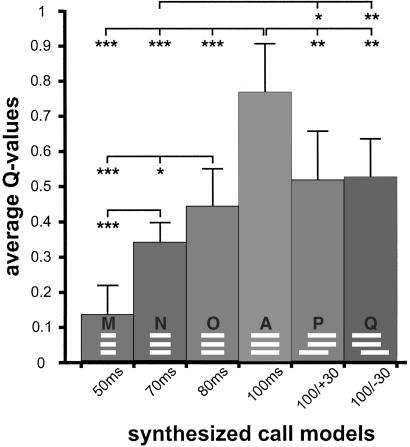
Figure 3.
Average Q value of the standard call model (A) compared with Q values of call models having shorter durations (M, N, O) or asynchronous on- and offsets of the fundamental frequency (P, Q). The structures of the call models are shown in, and the parameter values shown below the respective bars. Statistically significant differences between Q values are indicated with *, P < 0.05; **, P < 0.01; ***, P < 0.001.

